states_sf <- states(cb = TRUE, resolution = "20m") %>%
filter(!STUSPS %in% c("AK", "HI", "PR", "VI", "GU", "AS", "MP"))
counties_sf <- counties(cb = TRUE, resolution = "20m") %>%
filter(!STATEFP %in% c("02", "15", "72", "78", "66", "60", "69"))Introduction to Maps
Federal Reserve Bank of Boston | New England Public Policy Center
Andrew Van Leuven | University of Vermont
October 1, 2026
Follow Along
Scan to download the R script used in today’s demo:

GitHub Link: https://github.com/andrewvanleuven/andrewvanleuven.github.io/blob/main/bostonfed_neppc/demo_script.R
Agenda
- Mapping basics
- Mapping in ggplot2
- Census data with
tidycensus - Point data and basic GIS operations
Packages We’ll Use Today
install.packages(c(
  "tidyverse",   # data manipulation + ggplot2
  "sf",          # spatial data in R
  "tigris",      # US Census boundary files
  "tidycensus",  # Census + ACS data with geometry
  "mapgl",       # interactive web maps
  "rmapshaper",  # simplifying boundaries for web maps
  "classInt",    # natural breaks for color scales
  "RColorBrewer",# color palettes
  "patchwork"    # side-by-side ggplots
))
Part 1: Mapping Basics
What Is GIS?
Geographic Information Systems = data + location
- Any dataset with a spatial component can be put on a map
- Regional economics is inherently spatial: labor markets, commuting sheds, housing markets, municipal finance
- Maps reveal patterns that tables and charts simply cannot
Today’s goal: get you from zero to a working map pipeline in R
Types of Spatial Data
Vector data (what we’ll use today)
| Type | Examples |
|---|---|
| Points | employers, schools, stores, transit stops |
| Lines | roads, rivers, rail corridors |
| Polygons | towns, counties, states, tracts |
Raster data (not today)
- A grid of cells, like a photo
- Elevation, land cover, satellite imagery
- Temperature, precipitation, and other climate variables
- Handled in R via
terra/stars
What Lives in an sf Object?
An sf data frame is just a regular data frame with one extra column: geometry
Simple feature collection with 3,234 features
Geometry type: MULTIPOLYGON
CRS: NAD83 (EPSG:4269)

   GEOID  NAME         STATEFP  ALAND        geometry
1  01001  Autauga      01       1539602840   MULTIPOLYGON(...)
2  01003  Baldwin      01       4117521611   MULTIPOLYGON(...)
3  01005  Barbour      01       2291820706   MULTIPOLYGON(...)
The geometry column is a list of all the coordinate pairs (longitude, latitude) that define each shape. For a polygon, it’s every vertex. For a point, it’s just one.
Coordinate Reference Systems
The earth is round. Maps are flat. Something has to give.
A CRS defines how 3D coordinates get projected onto a 2D surface.
Three CRS you’ll use constantly:
| CRS | EPSG | When you’ll see it |
|---|---|---|
| WGS84 | 4326 | GPS coordinates, GeoJSON files, web APIs, mapgl |
| Albers Equal Area | 5070 | Thematic maps of the contiguous US |
| Massachusetts State Plane | 26986 | Regional maps of New England |
Rule of thumb: store and share data in 4326. Project to 5070 for a static map of the contiguous US, and to a regional CRS for anything smaller.
Why Projections Matter

“Comparison of tangent and secant cylindrical, conic and azimuthal map projections” by cmglee et al., CC BY-SA 4.0, via Wikimedia Commons
Types of Maps
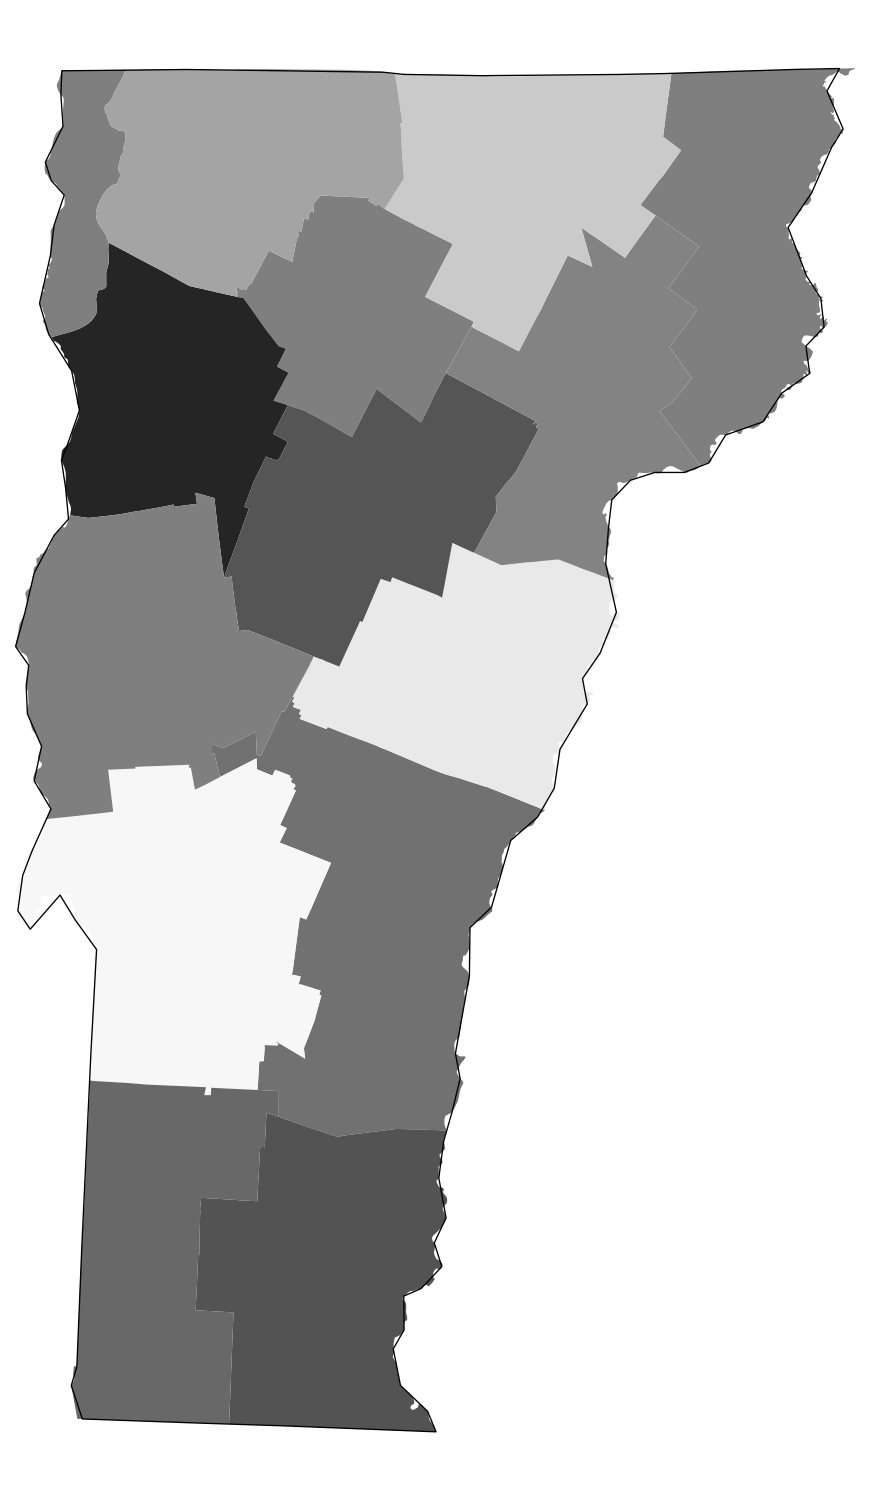
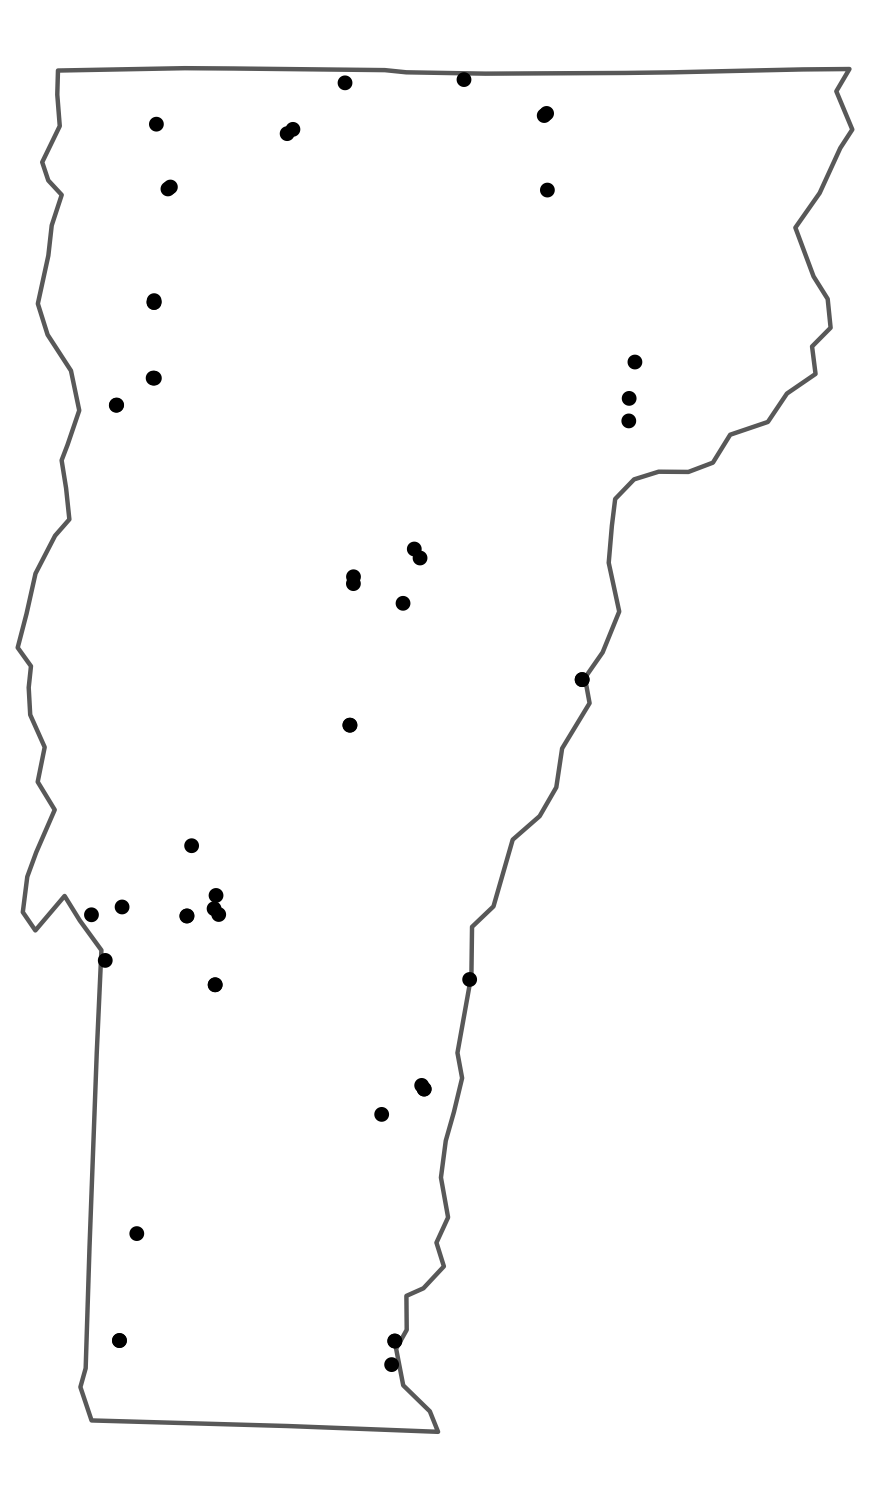
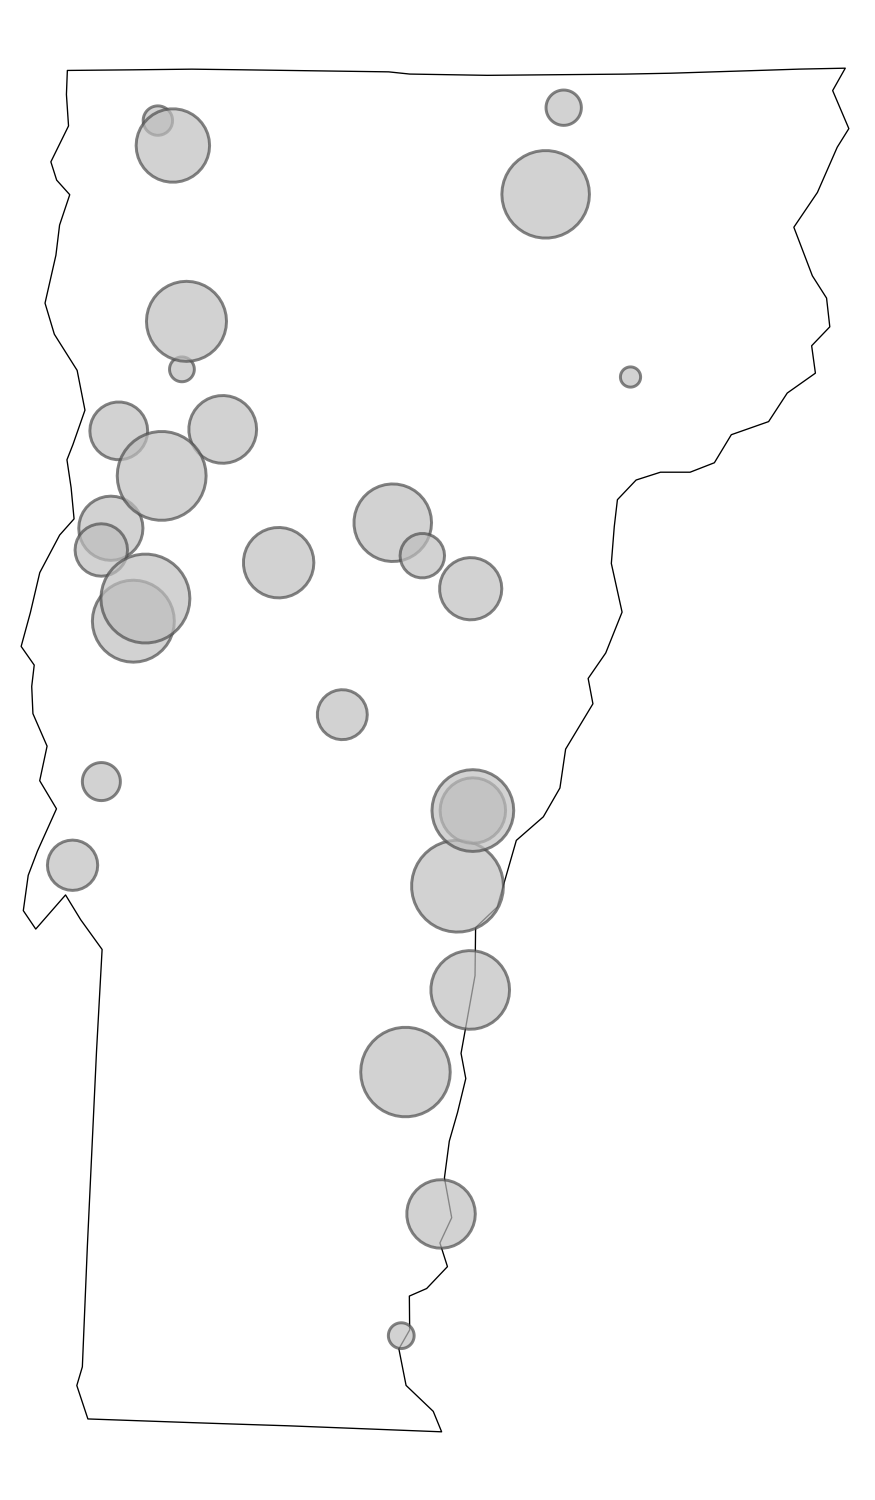
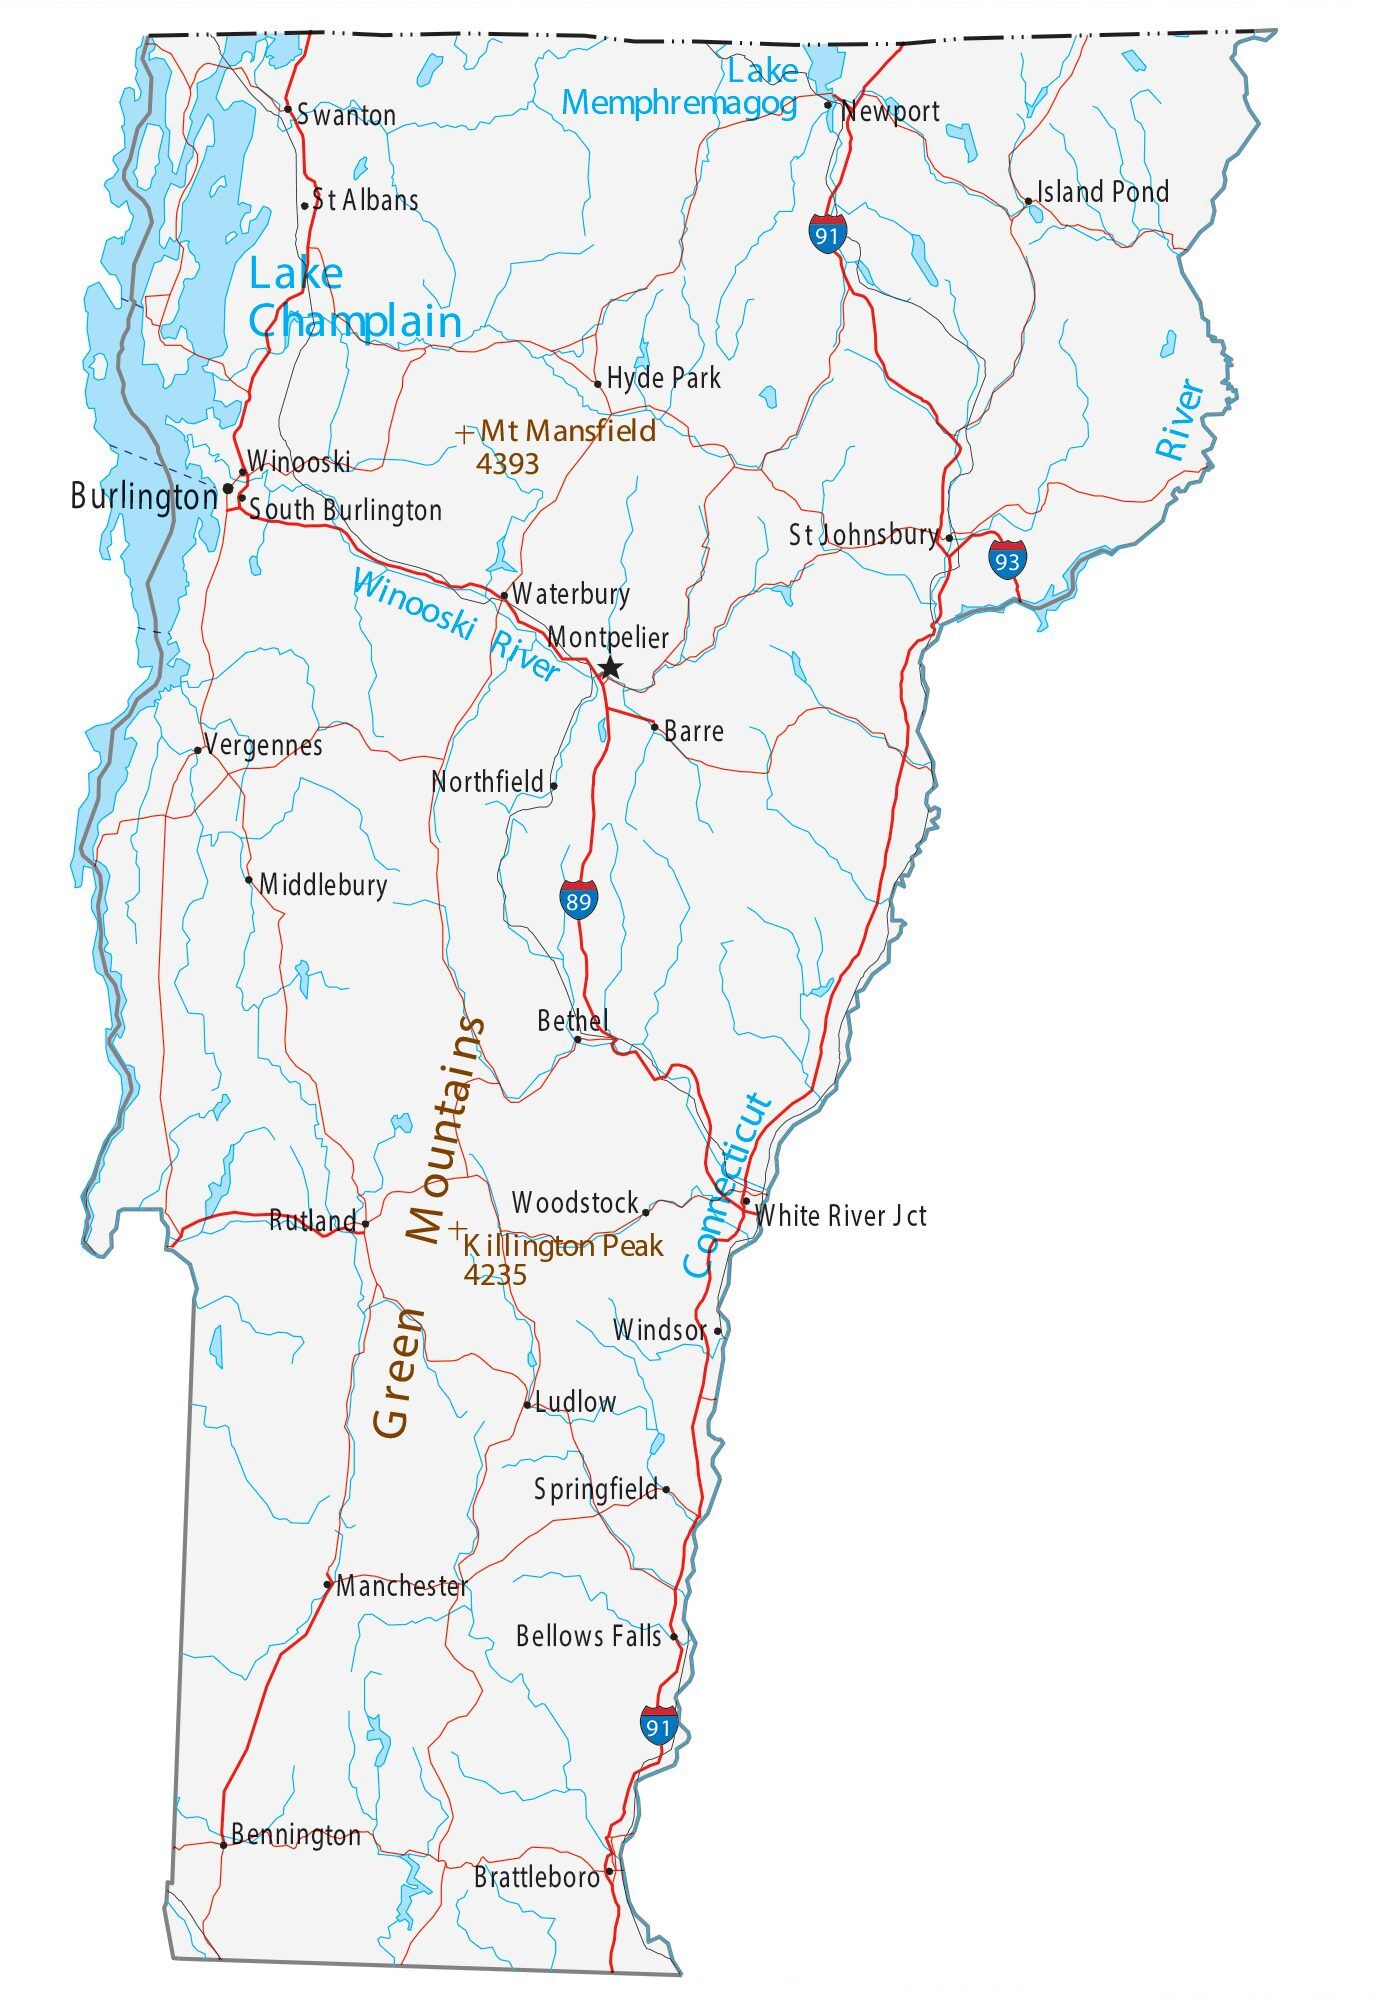
Choropleth: areas shaded by value
Dot map: one dot per unit
Proportional symbol: symbol size = quantity
Reference: orientation / context
Part 2: Mapping in ggplot2
Getting Boundary Data
- TIGER/Line files: the Census Bureau’s authoritative geographic boundary dataset, covering states, counties, tracts, roads, water features, and more
tigris: an R package that downloads TIGER/Line files directly from the Census API and returns them assfobjects, ready to map
cb = TRUE: simplified cartographic boundary (better for maps)resolution = "20m": 1:20,000,000 scale (right for national maps)- The filter removes Alaska, Hawaii, and territories
Your First Map
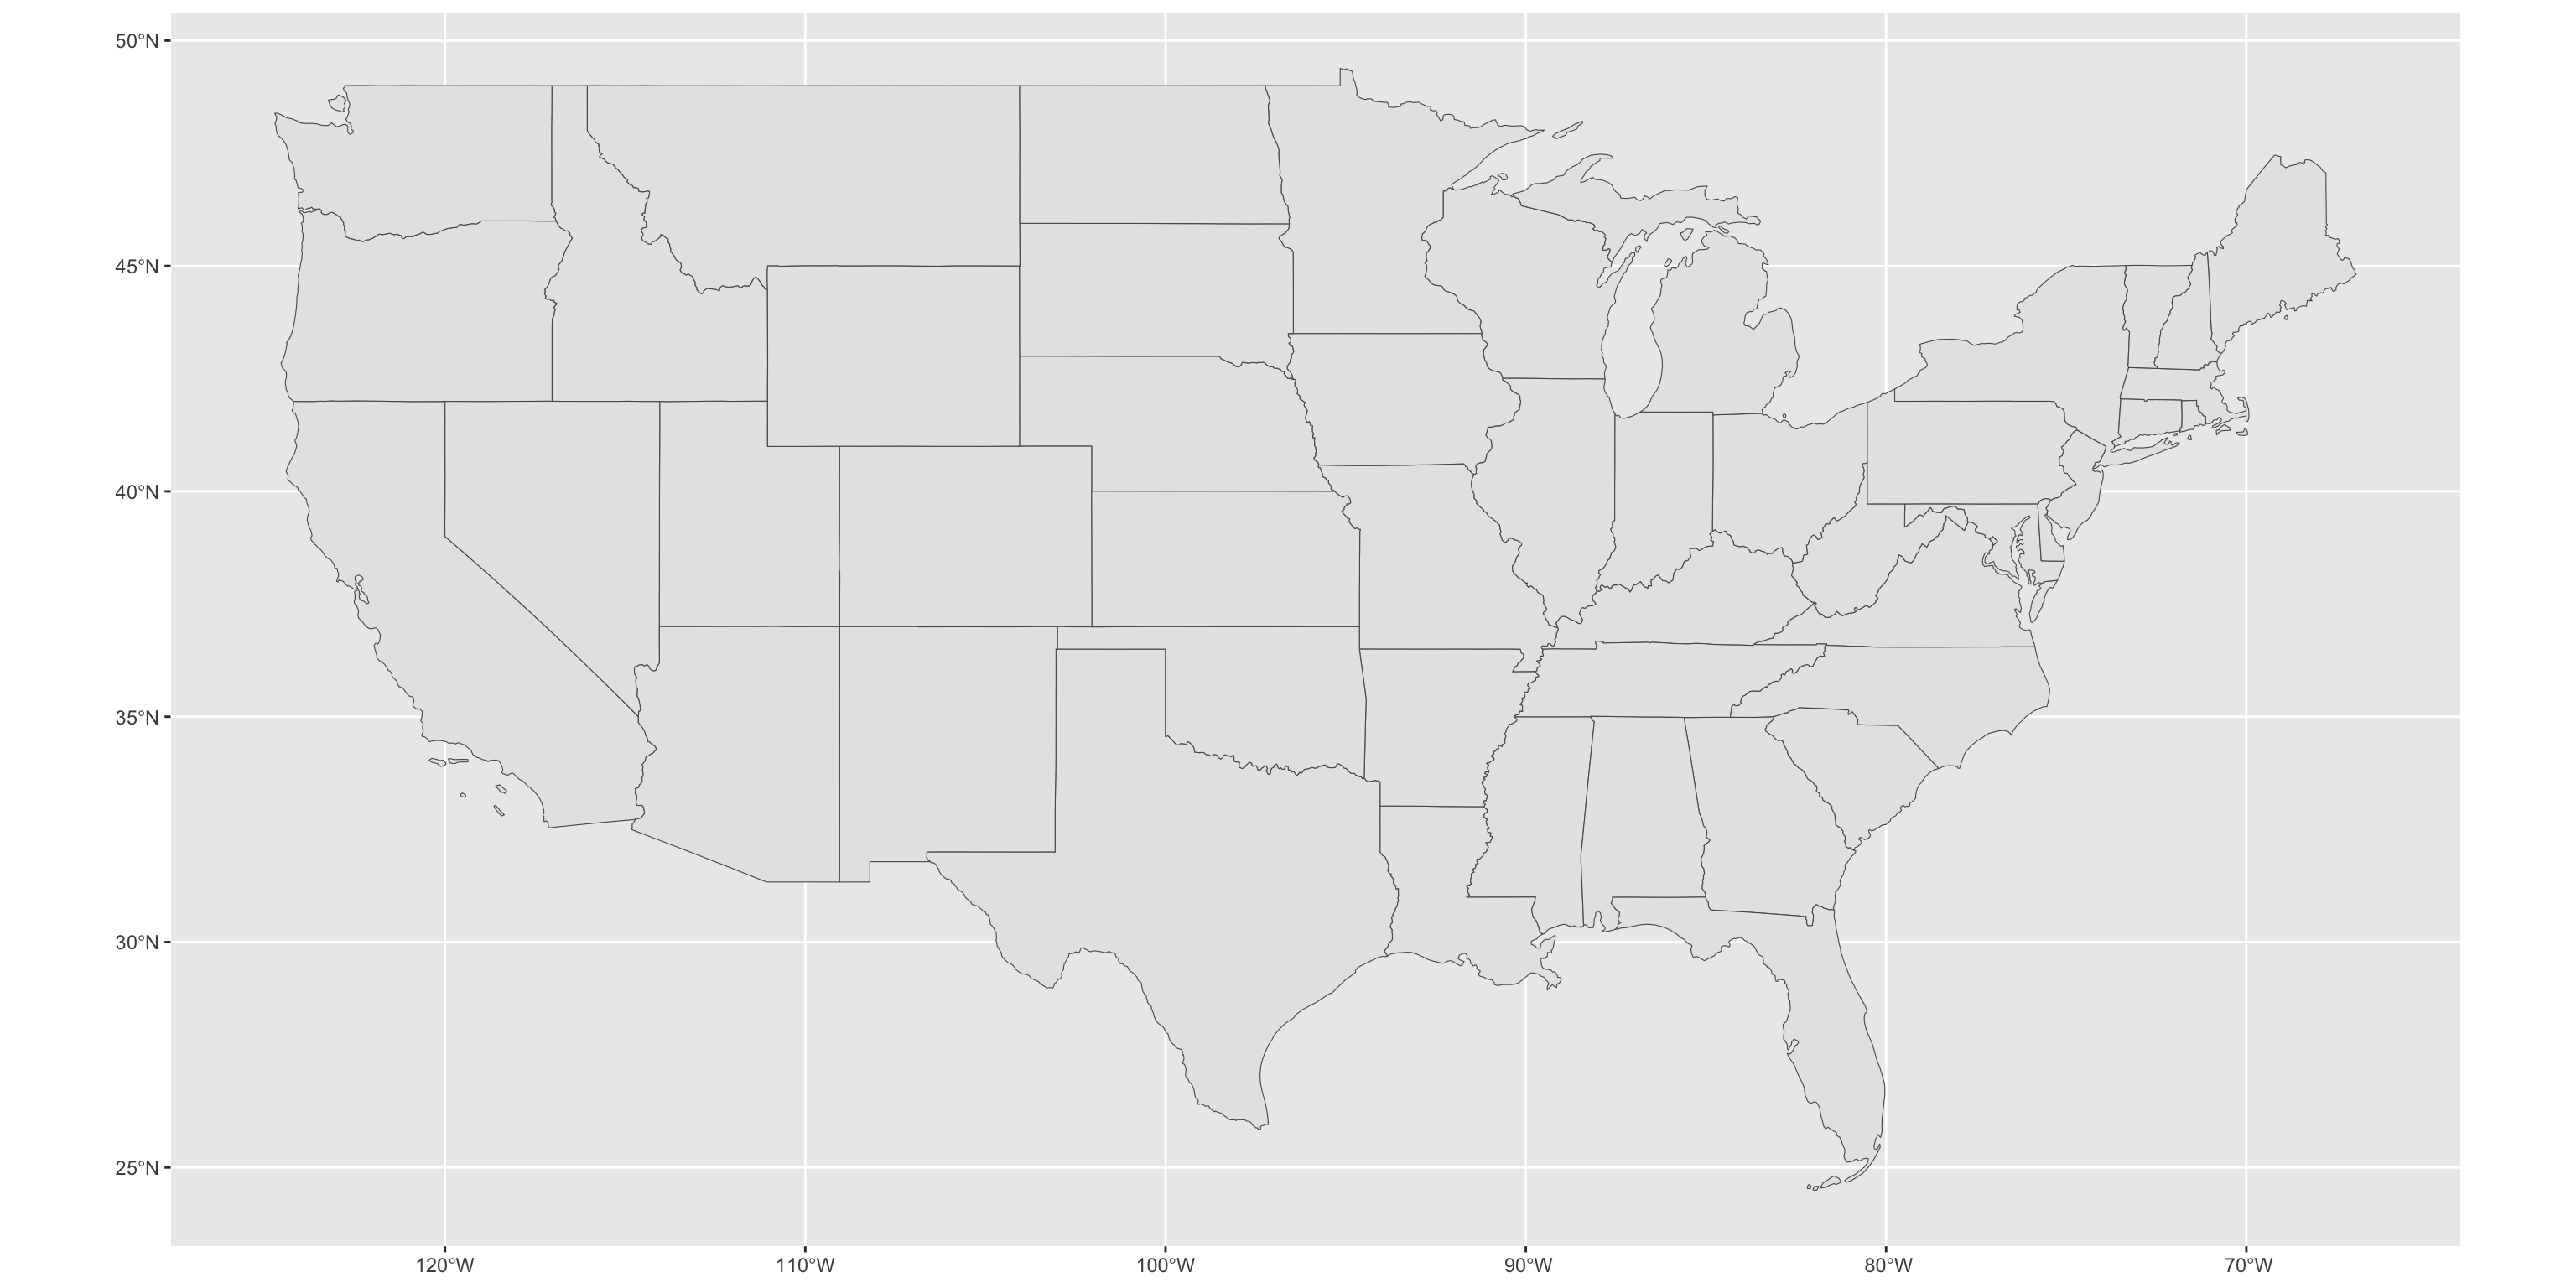
geom_sf() reads the geometry column and draws the shapes. But it looks flat and weird – let’s fix that.
Your First Map
Applying a Projection
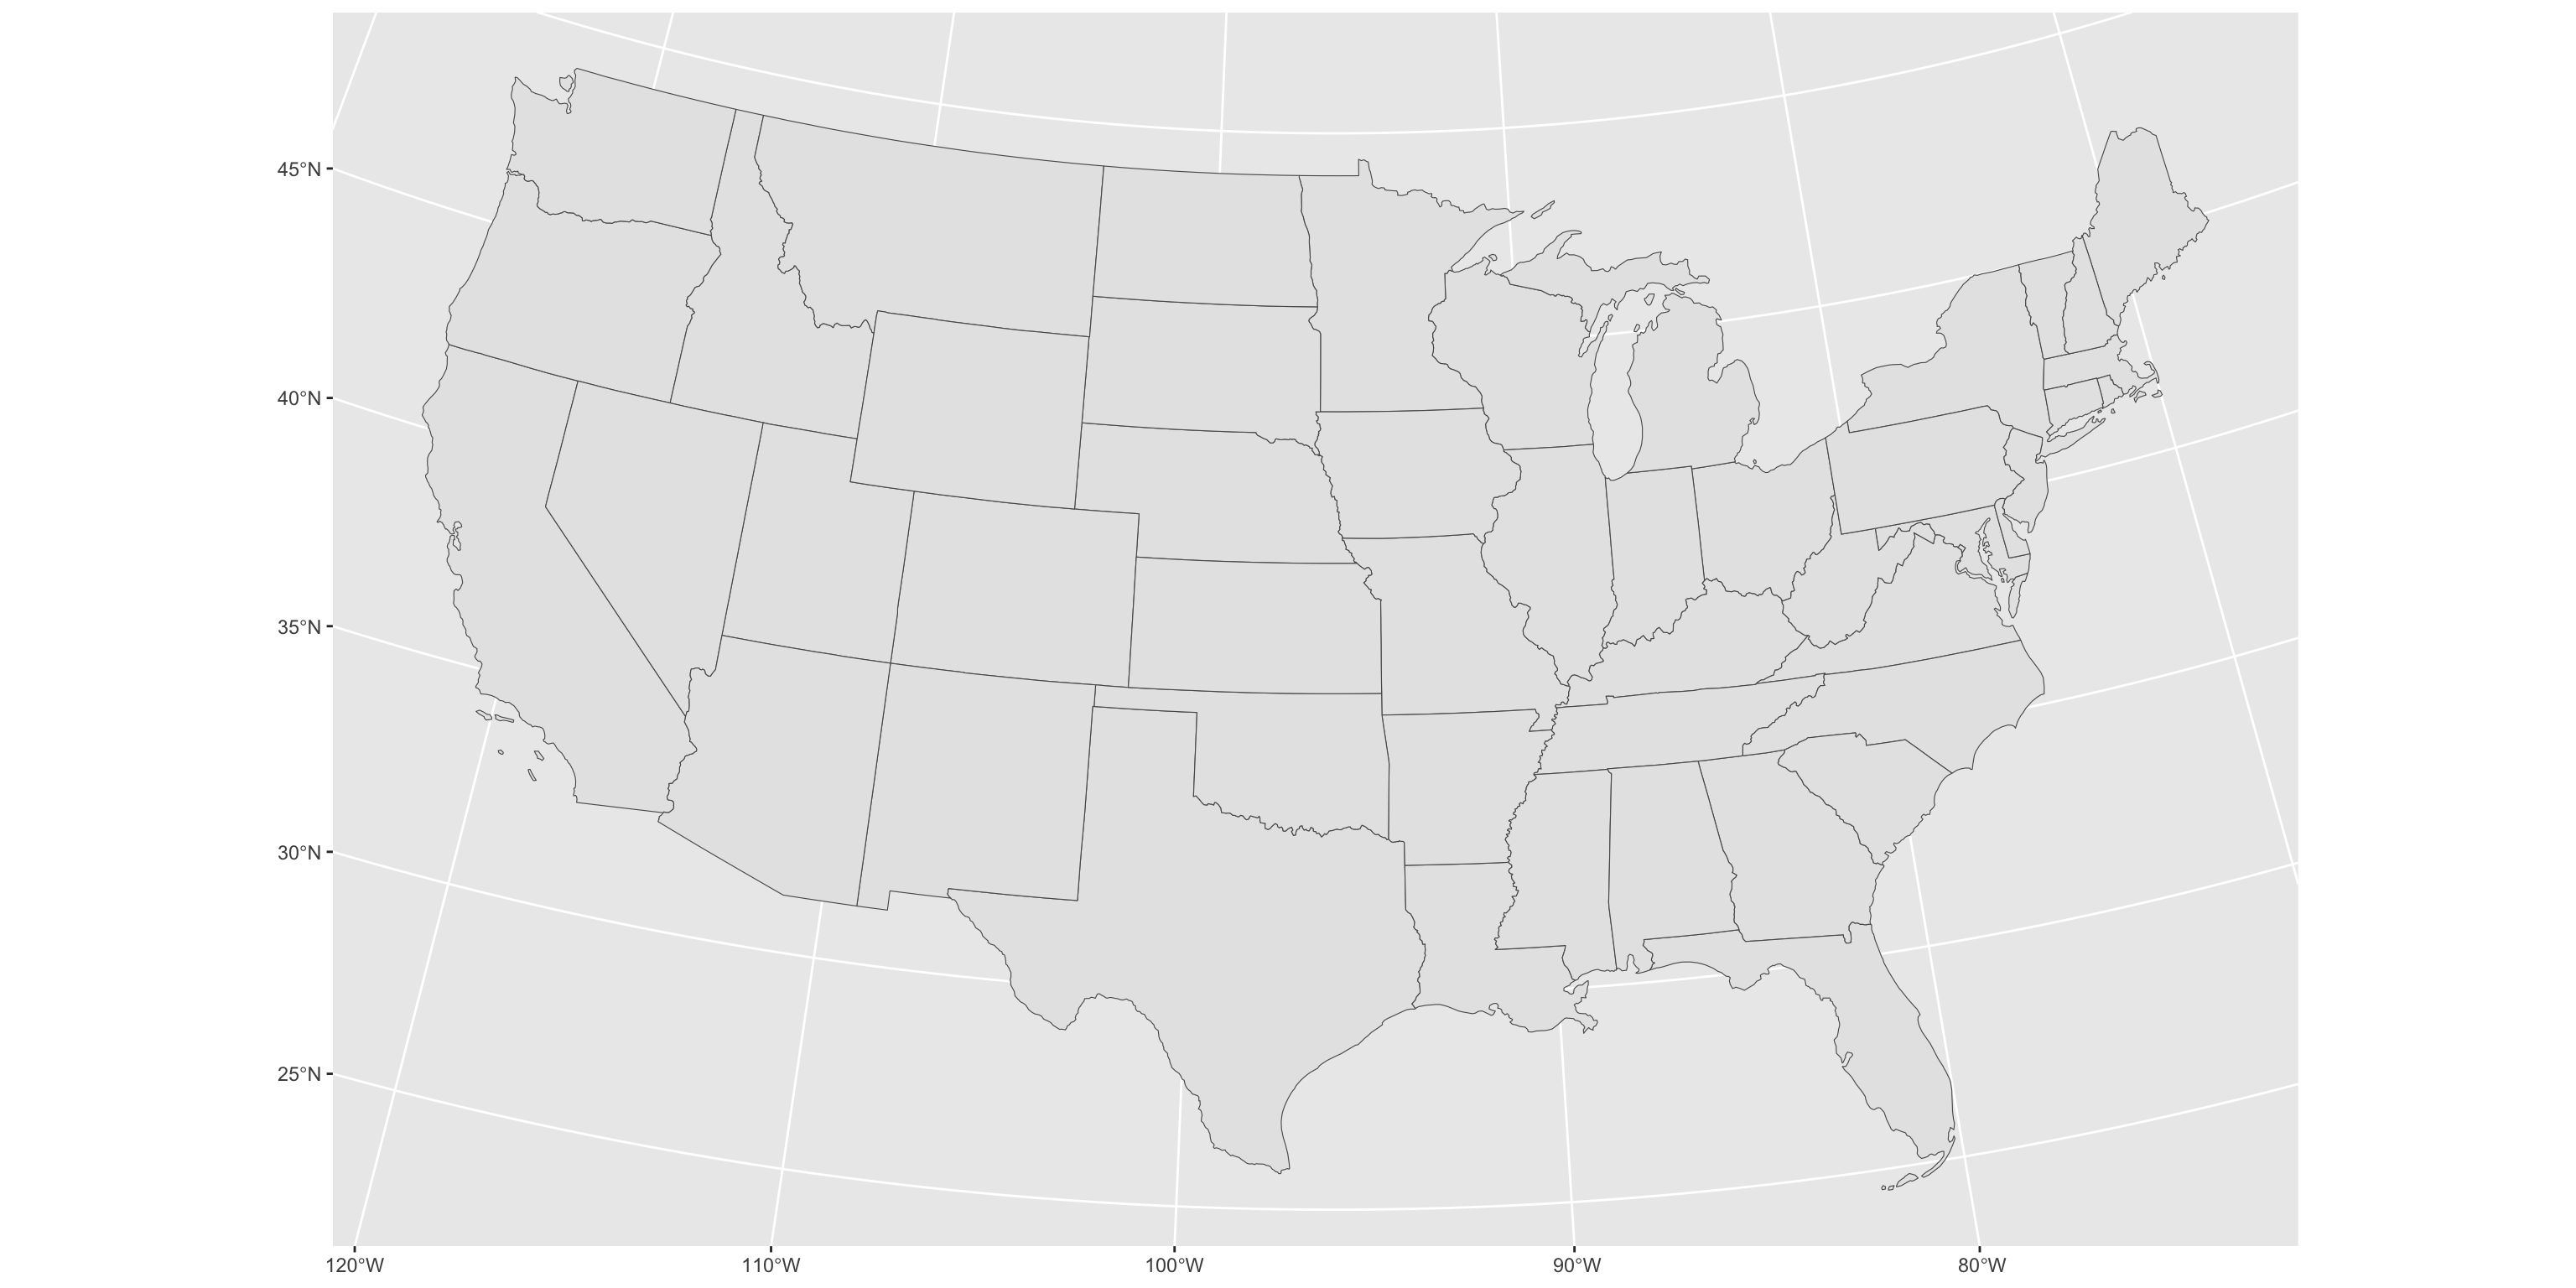
coord_sf() reprojects the visualization without modifying your data. This single line is the most impactful improvement you can make to a US national map.
Applying a Projection
Styling
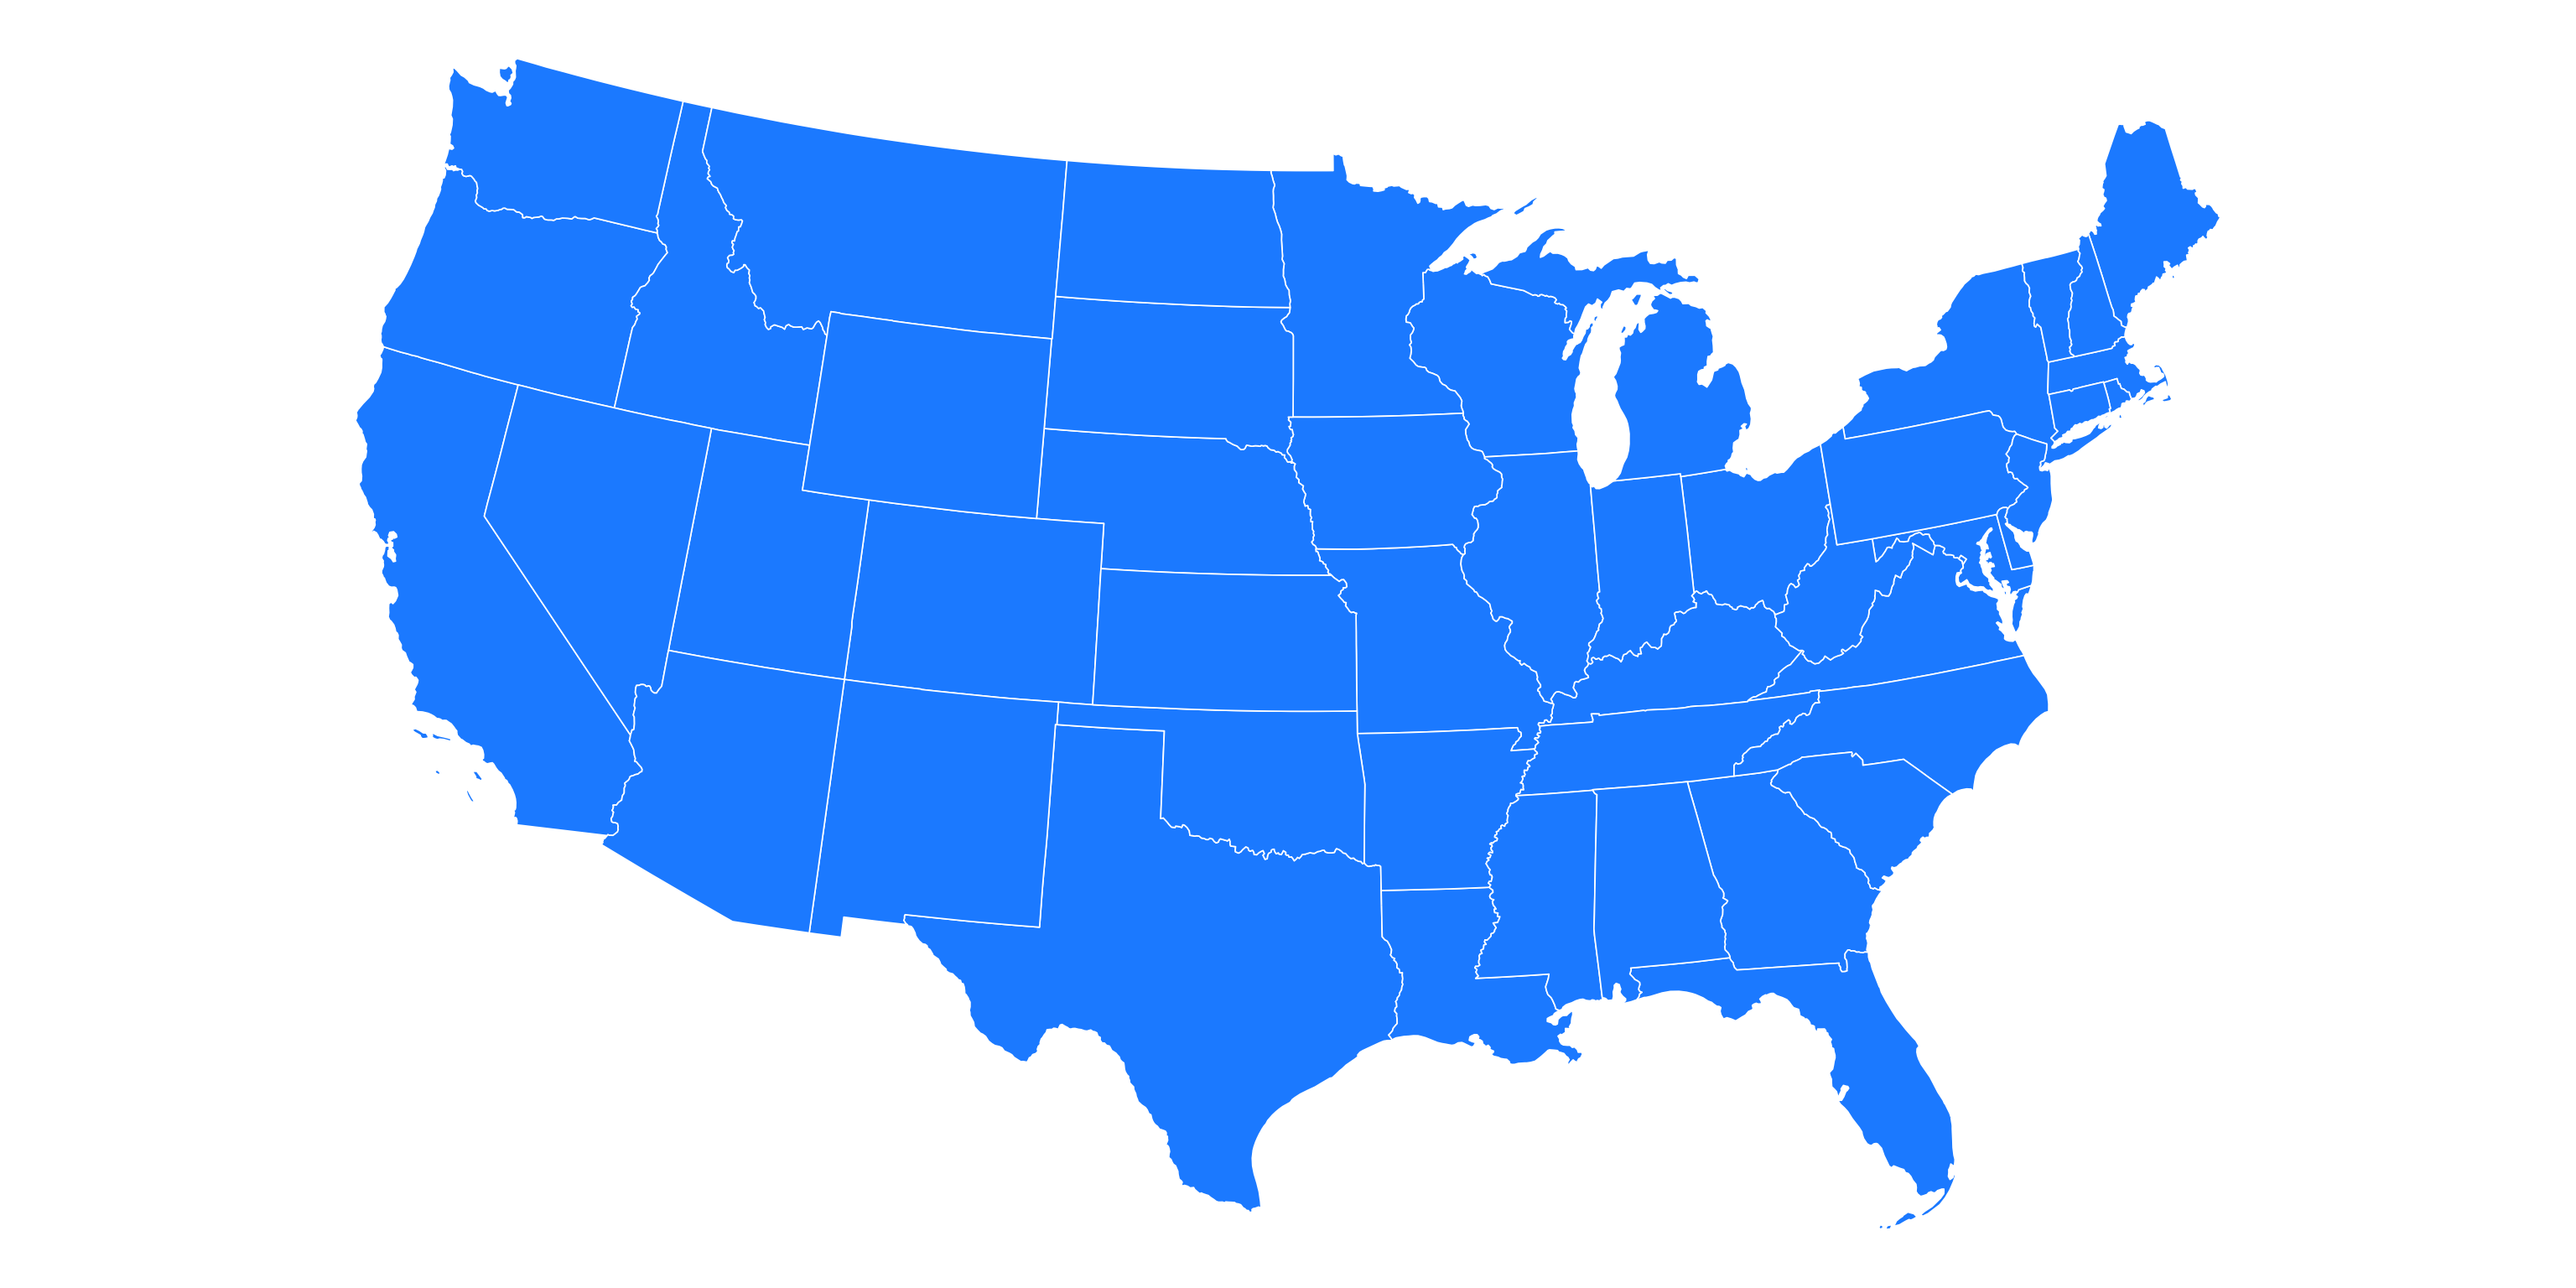
theme_void() removes axes, gridlines, and background – almost always the right choice for a finished map.
Styling
Zooming In: New England
An sf object filters like any data frame, so a regional map is one filter() away.
ggplot()sets the map extent from the data, so the map zooms to New England on its own- 5070 is centered on the middle of the country (96°W), so New England comes out tilted. A projection centered on the region (71.5°W) sits it upright
Real Data: LACE
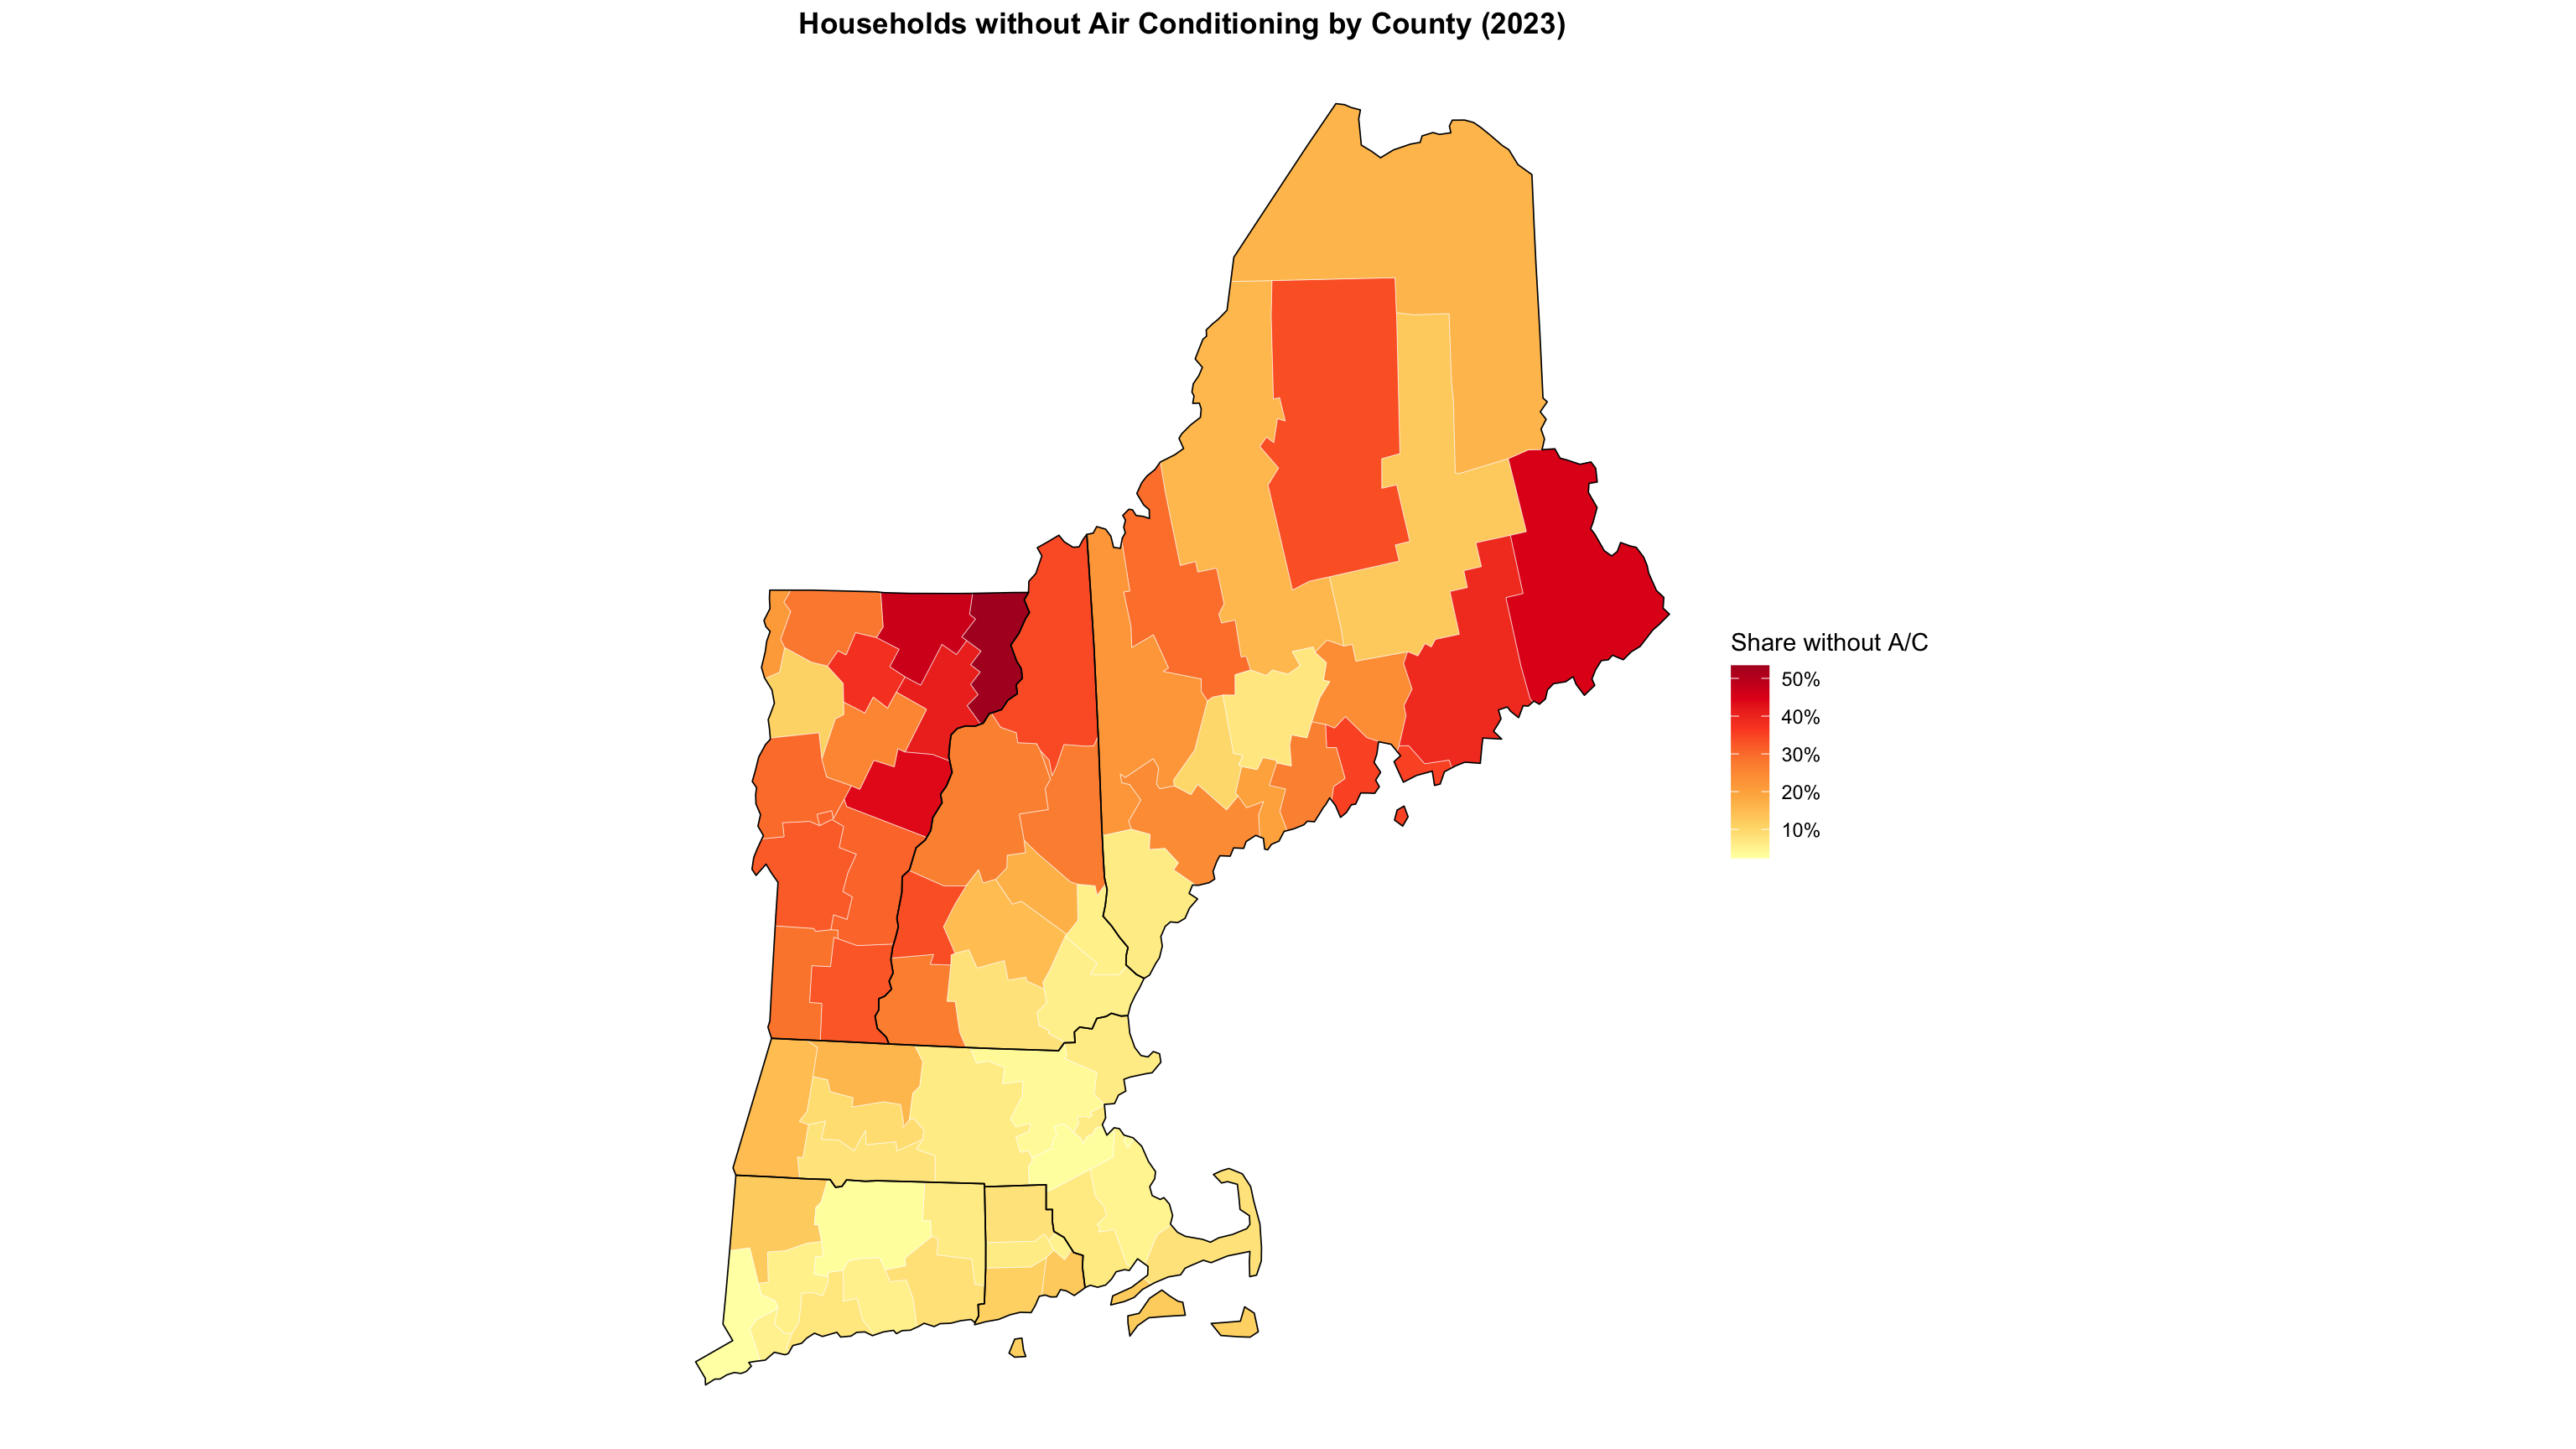
New from the Census Bureau: county-level estimates of households without air conditioning.
This is the standard workflow: get boundaries from tigris, join your data on GEOID, map it.
Building the Map Incrementally
ggplot(lace_map) +
  geom_sf(aes(fill = NO_AC_PE/100), color = "white", linewidth = 0.1) +
  geom_sf(data = ne_sf, fill = NA, color = "black", linewidth = 0.3) +
  coord_sf(crs = ne_crs) +
  scale_fill_distiller(
    palette = "YlOrRd", direction = 1,
    labels = percent, name = "Share without A/C"
  ) +
  theme_void() +
  theme(legend.position = "right",
        plot.title = element_text(face = "bold", hjust = .5)) +
labs(title = "Households without Air Conditioning by County (2023)")Building the Map Incrementally
Color Scale Options
# Sequential (one hue, light to dark)
scale_fill_distiller(palette = "YlOrRd", direction = 1)
scale_fill_viridis_c(option = "rocket")

# Diverging (two hues, use when 0 means something)
scale_fill_distiller(palette = "RdBu", direction = 1)

# Right-skewed data: log-transform the scale
scale_fill_viridis_c(trans = "log10", labels = scales::comma)
Avoid rainbow palettes (
rainbow(),jet). They are not perceptually uniform and create false visual boundaries in your data.
- ColorBrewer (colorbrewer2.org) — designed by cartographer Cynthia Brewer, it provides rigorously tested sequential, diverging, and qualitative palettes optimized for maps. No need to reinvent the wheel; the cartographers already laid the groundwork.
Part 3: Census Data
tidycensus
tidycensus pulls Census Bureau data directly into R, with geometry attached if you want it.
Covers: Decennial Census, ACS 1-year and 5-year, and more
Finding Variables
# A tibble: 34 × 3
   name       label                                                      concept
   <chr>      <chr>                                                      <chr>
 1 B25040_001 Estimate!!Total:                                           House …
 2 B25040_002 Estimate!!Total:!!Utility gas                              House …
 3 B25040_003 Estimate!!Total:!!Bottled or tank gas (propane, butane, e… House …
 4 B25040_004 Estimate!!Total:!!Electricity                              House …
 5 B25040_005 Estimate!!Total:!!Fuel oil, kerosene, etc.                 House …
 6 B25040_006 Estimate!!Total:!!Coal or coke                             House …
 7 B25040_007 Estimate!!Total:!!Wood                                     House …
 8 B25040_008 Estimate!!Total:!!Solar energy                             House …
 9 B25040_009 Estimate!!Total:!!Other fuel                               House …
10 B25040_010 Estimate!!Total:!!No fuel used                             House …
# ℹ 24 more rows
There are ~28,000 ACS 5-year variables. load_variables() + str_detect() is how you find what you need.
Pulling Heating Fuel Data with Geometry
geometry = TRUE is the killer feature: one call returns data and boundaries together.
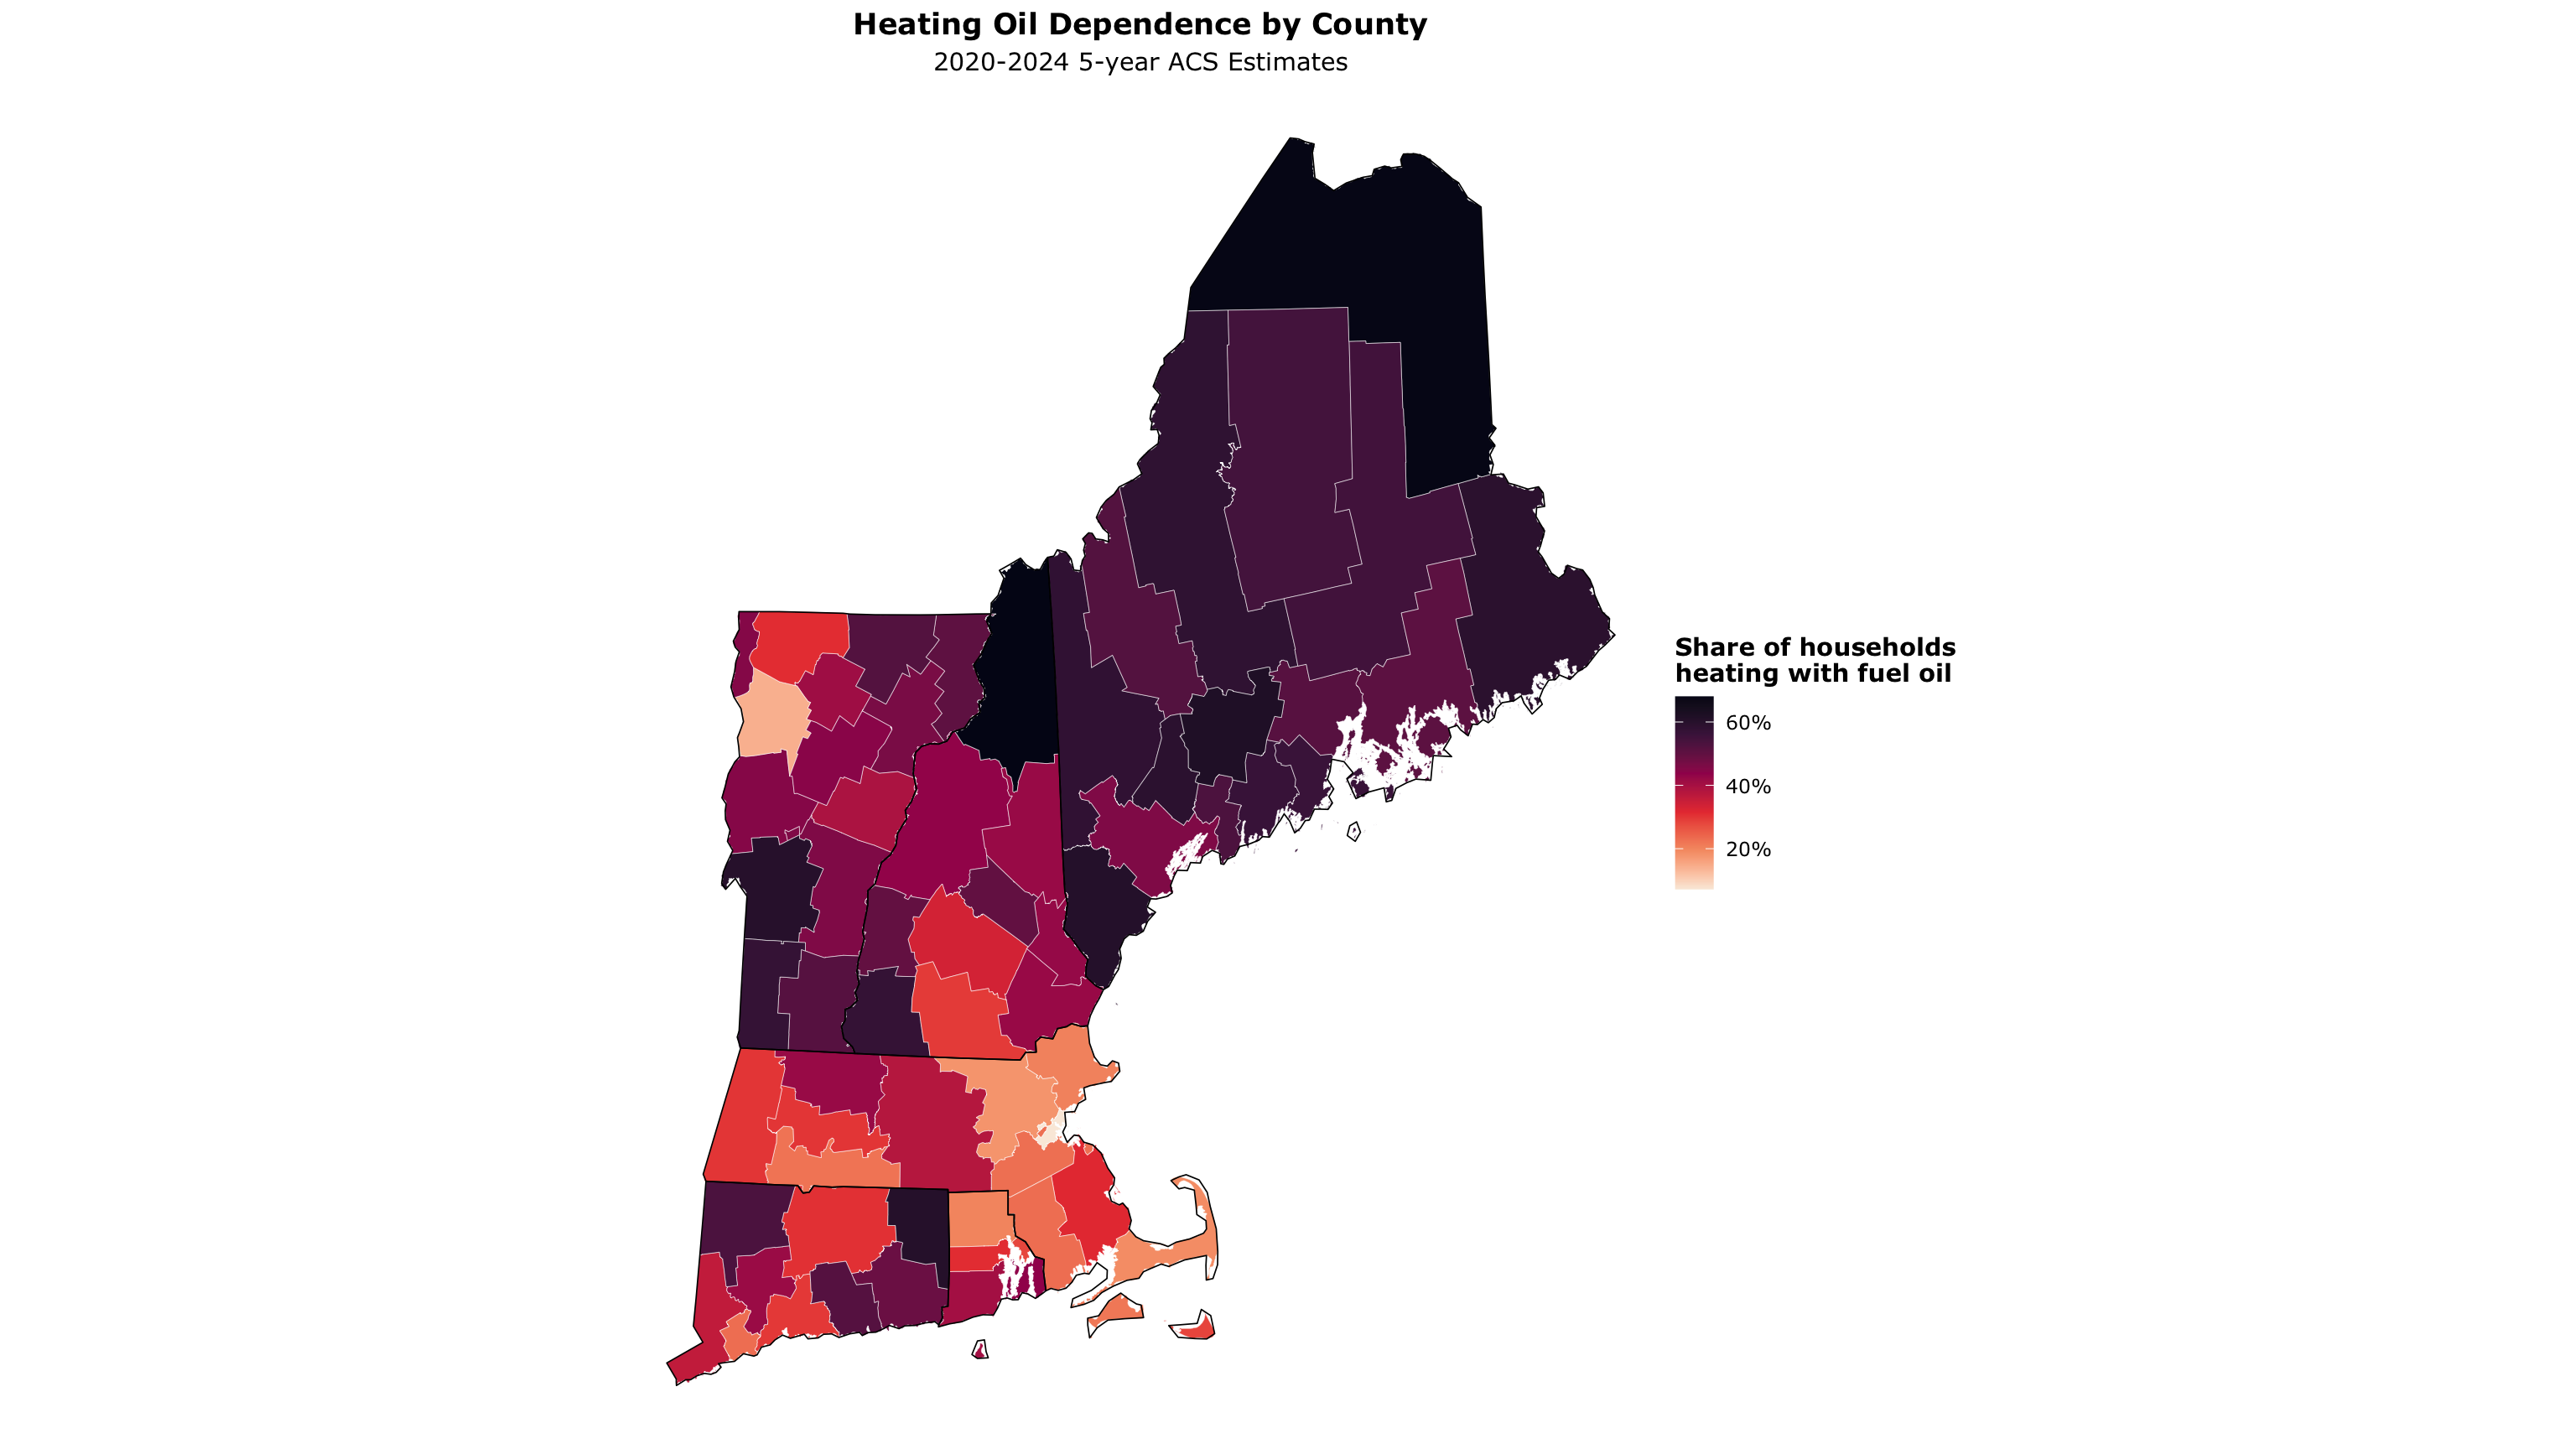
Heating Oil Dependence by County
ggplot(heating_oil) +
  geom_sf(aes(fill = oil_pct), color = "white", linewidth = 0.1) +
  geom_sf(data = ne_sf, fill = NA, color = "black", linewidth = 0.3) +
  coord_sf(crs = ne_crs) +
  scale_fill_viridis_c(
    name = "Share of households\nheating with fuel oil",
    labels = percent_format(accuracy = 1),
    option = "rocket",
    direction = -1
  ) +
  theme_void(base_family = "Verdana") +
  theme(legend.title = element_text(face = "bold"),
        plot.title = element_text(face = "bold", hjust = .5),
        plot.subtitle = element_text(hjust = .5)) +
  labs(title = "Heating Oil Dependence by County",
       subtitle = "2020-2024 5-year ACS Estimates")
Heating Oil Dependence by County
Going Smaller: Census Tracts
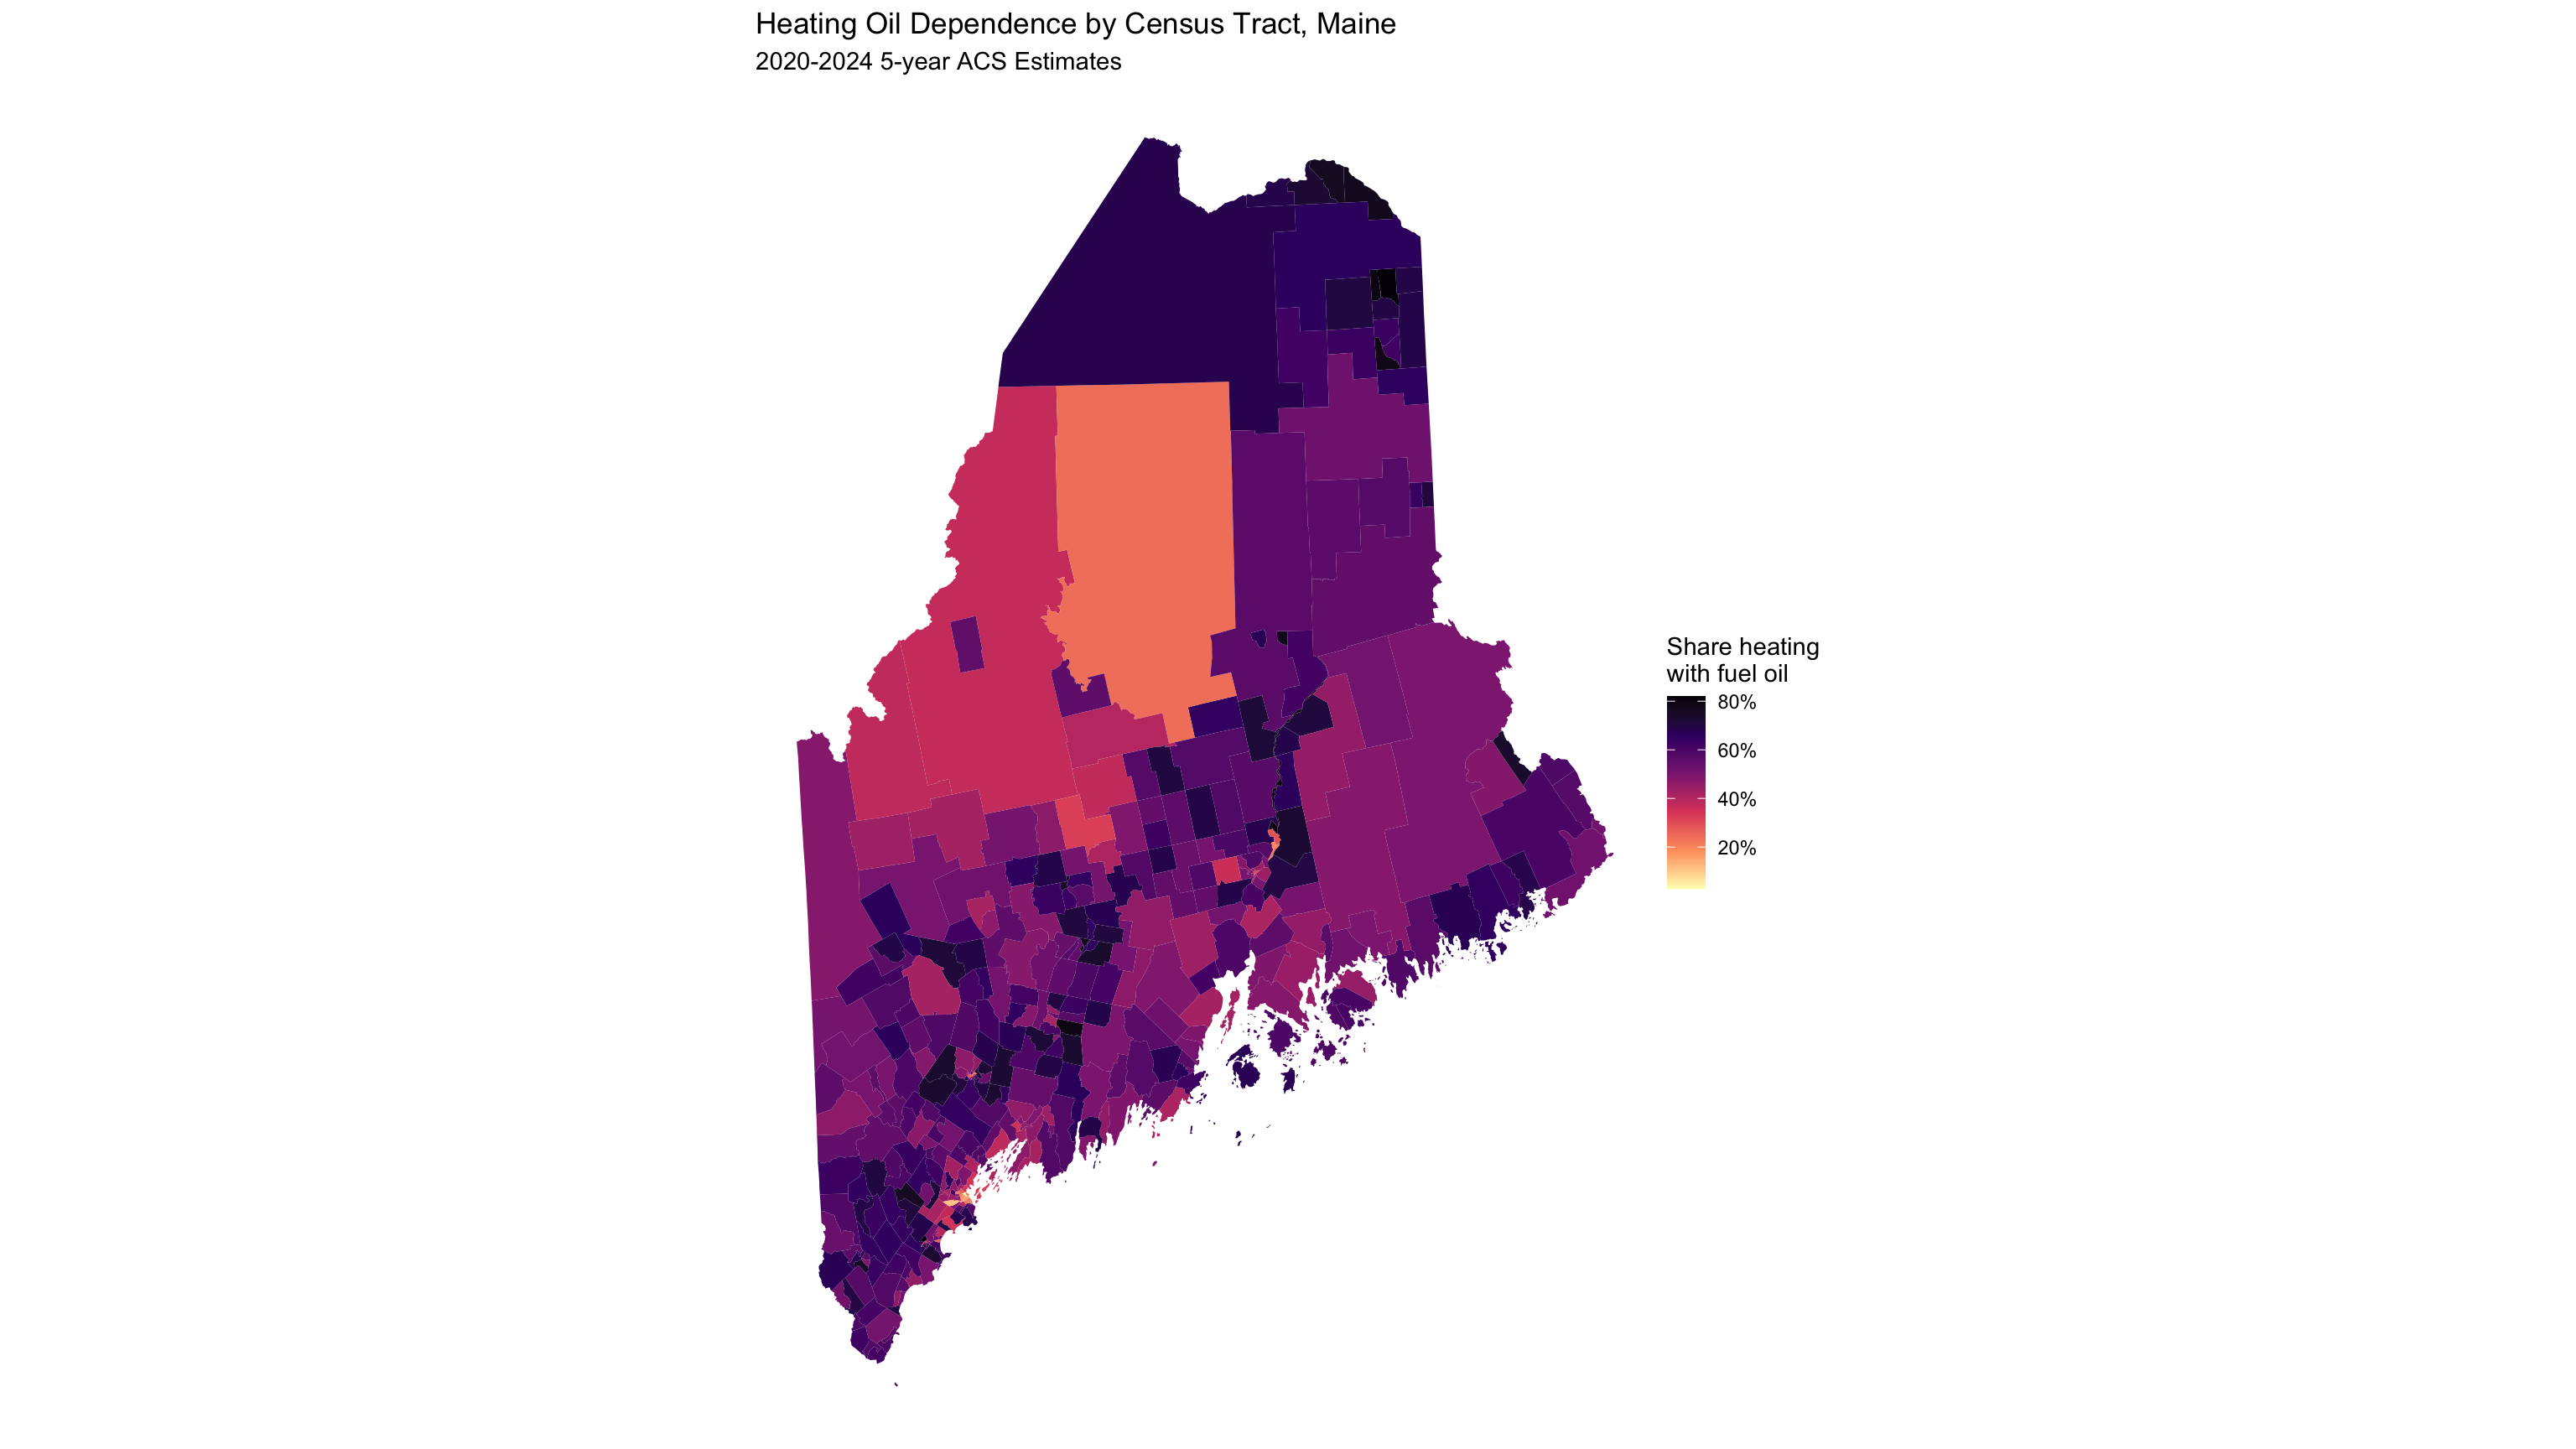
Change geography = "county" to geography = "tract":
get_acs(
  geography = "tract", state = "ME",
  variables = c(oil = "B25040_005", total = "B25040_001"),
  year = 2024, geometry = TRUE
) %>%
  select(GEOID, NAME, variable, estimate) %>%
  pivot_wider(names_from = variable, values_from = estimate) %>%
  mutate(oil_pct = oil / total) %>%
  ggplot() +
  geom_sf(aes(fill = oil_pct), color = NA) +
  coord_sf(crs = ne_crs) +
  scale_fill_viridis_c(option = "A", direction = -1,
                       name = "Share heating\nwith fuel oil",
                       labels = percent_format(accuracy = 1),
                       na.value = "grey90") +
  theme_void() +
  labs(title = "Heating Oil Dependence by Census Tract, Maine",
subtitle = "2020-2024 5-year ACS Estimates")Going Smaller: Census Tracts
A New England Quirk: Connecticut
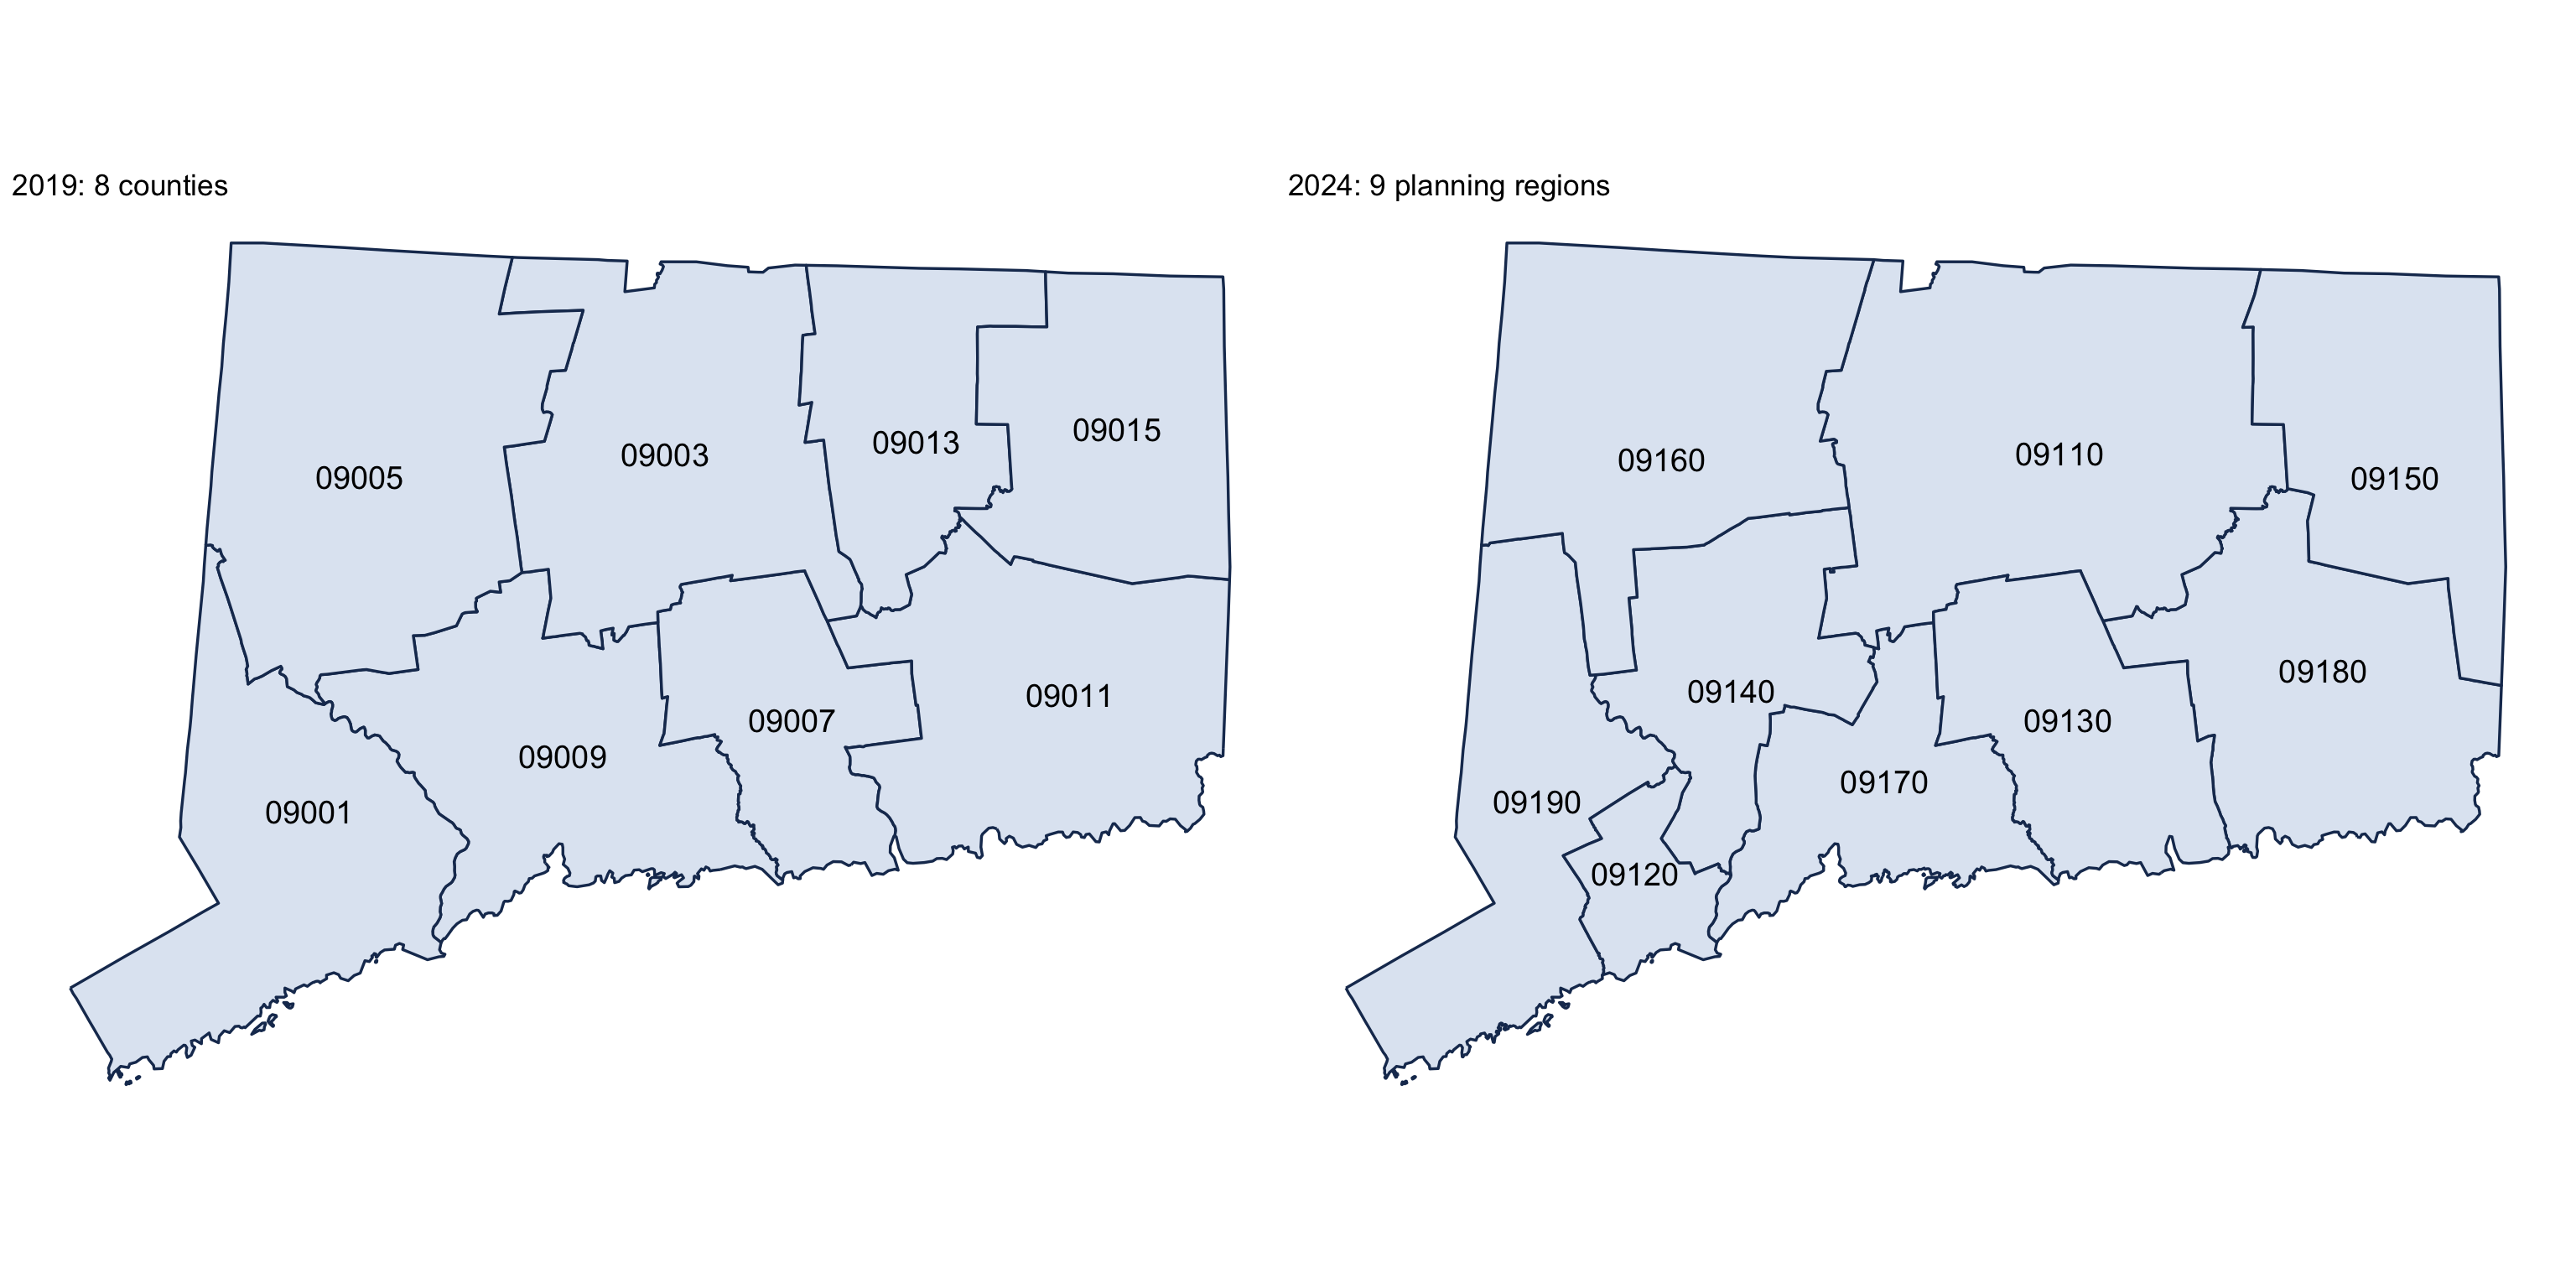
In 2022 the Census Bureau replaced Connecticut’s 8 counties with 9 planning regions.
ct_2019 <- counties(state = "CT", cb = TRUE, year = 2019)
ct_2024 <- counties(state = "CT", cb = TRUE, year = 2024)

ct_map <- function(x, title) {
  ggplot(x) +
    geom_sf(fill = "#dfe7f2", color = "#1b365d", linewidth = 0.6) +
    geom_sf_text(aes(label = GEOID), size = 5) +
    coord_sf(crs = ne_crs) +
    theme_void() +
    labs(title = title)
}

ct_map(ct_2019, "2019: 8 counties") + ct_map(ct_2024, "2024: 9 planning regions")
The boundaries and the GEOIDs changed (09001 → 09110–09190), so any county panel that spans 2022 breaks in Connecticut.
A New England Quirk: Connecticut
Towns: County Subdivisions
In New England, towns are the unit that matters. Census calls them county subdivisions.
wfh_towns <- function(year, geometry = FALSE) {
  map_dfr(ne_states, \(st) get_acs(
    geography = "county subdivision", state = st, year = year,
    variables = c(wfh = "B08301_021", workers = "B08301_001"),
    geometry = geometry
  )) %>%
    select(GEOID, NAME, variable, estimate) %>%
    pivot_wider(names_from = variable, values_from = estimate) %>%
    filter(workers > 0) %>%
    mutate(wfh_pct = wfh / workers)
}

wfh_2019 <- wfh_towns(2019)
wfh_2024 <- wfh_towns(2024, geometry = TRUE)
get_acs() only fetches county subdivision geometry one state at a time, so we loop with map_dfr().
Joining Across the Connecticut Break
A town GEOID embeds its county, so every Connecticut town “moved.” The fix is to join on state FIPS + the 5-digit town code, which never changed:
Finding Better Breaks: Jenks
Skewed data looks like one color with a linear scale. Jenks natural breaks fix that.
Using the combined distribution ensures both maps share the same color scale.
Keeping Web Maps Light
Interactive maps ship every vertex to the browser. Simplify what the widget embeds:
keep = 0.35keeps 35% of the vertices; shared borders stay shared, so towns still tile- Keep full resolution for analysis and static maps
Comparing Maps with compare()
wfh_map <- function(column, title) {
  maplibre(bounds = ne_sf, style = carto_style("voyager")) %>%
    add_source(id = "towns", data = wfh_web) %>%
    add_fill_layer(id = column, source = "towns",
      fill_color = interpolate(column = column,
                               values = brks, stops = pal, na_color = "lightgrey"),
      fill_opacity = 0.85, tooltip = "NAME") %>%
    add_line_layer(id = "states", source = ne_sf, line_width = .5) %>%
    add_continuous_legend(title, values = percent(brks), colors = pal,
                          position = "top-left")
}

compare(wfh_map("wfh_pct_2019", "Work from home, 2015-2019"),
        wfh_map("wfh_pct_2024", "Work from home, 2020-2024"),
height = "900px")Comparing Maps with compare()
Part 4: Point Data and GIS
From Table to Map
Any table with latitude and longitude columns can become a spatial dataset.
Rows: 4,603
Columns: 8
$ ncessch   <chr> "090000201136", "090000201137", "090000201138", "09000020113…
$ name      <chr> "A. I. Prince Technical High School", "Bullard-Havens Techni…
$ city      <chr> "Hartford", "Bridgeport", "New Britain", "Groton", "Hamden",…
$ state     <chr> "CT", "CT", "CT", "CT", "CT", "CT", "CT", "CT", "CT", "CT", …
$ county    <chr> "Capitol Planning Region", "Greater Bridgeport Planning Regi…
$ locale    <chr> "City", "City", "Suburb", "Rural", "Suburb", "Suburb", "Subu…
$ latitude  <dbl> 41.74248, 41.19971, 41.68677, 41.34212, 41.34246, 41.33504, …
$ longitude <dbl> -72.70677, -73.16397, -72.80608, -72.01666, -72.94175, -73.0…st_as_sf(): Adding Geometry
st_as_sf() turns lat/lon columns into a geometry column. After that, it’s a normal sf object.
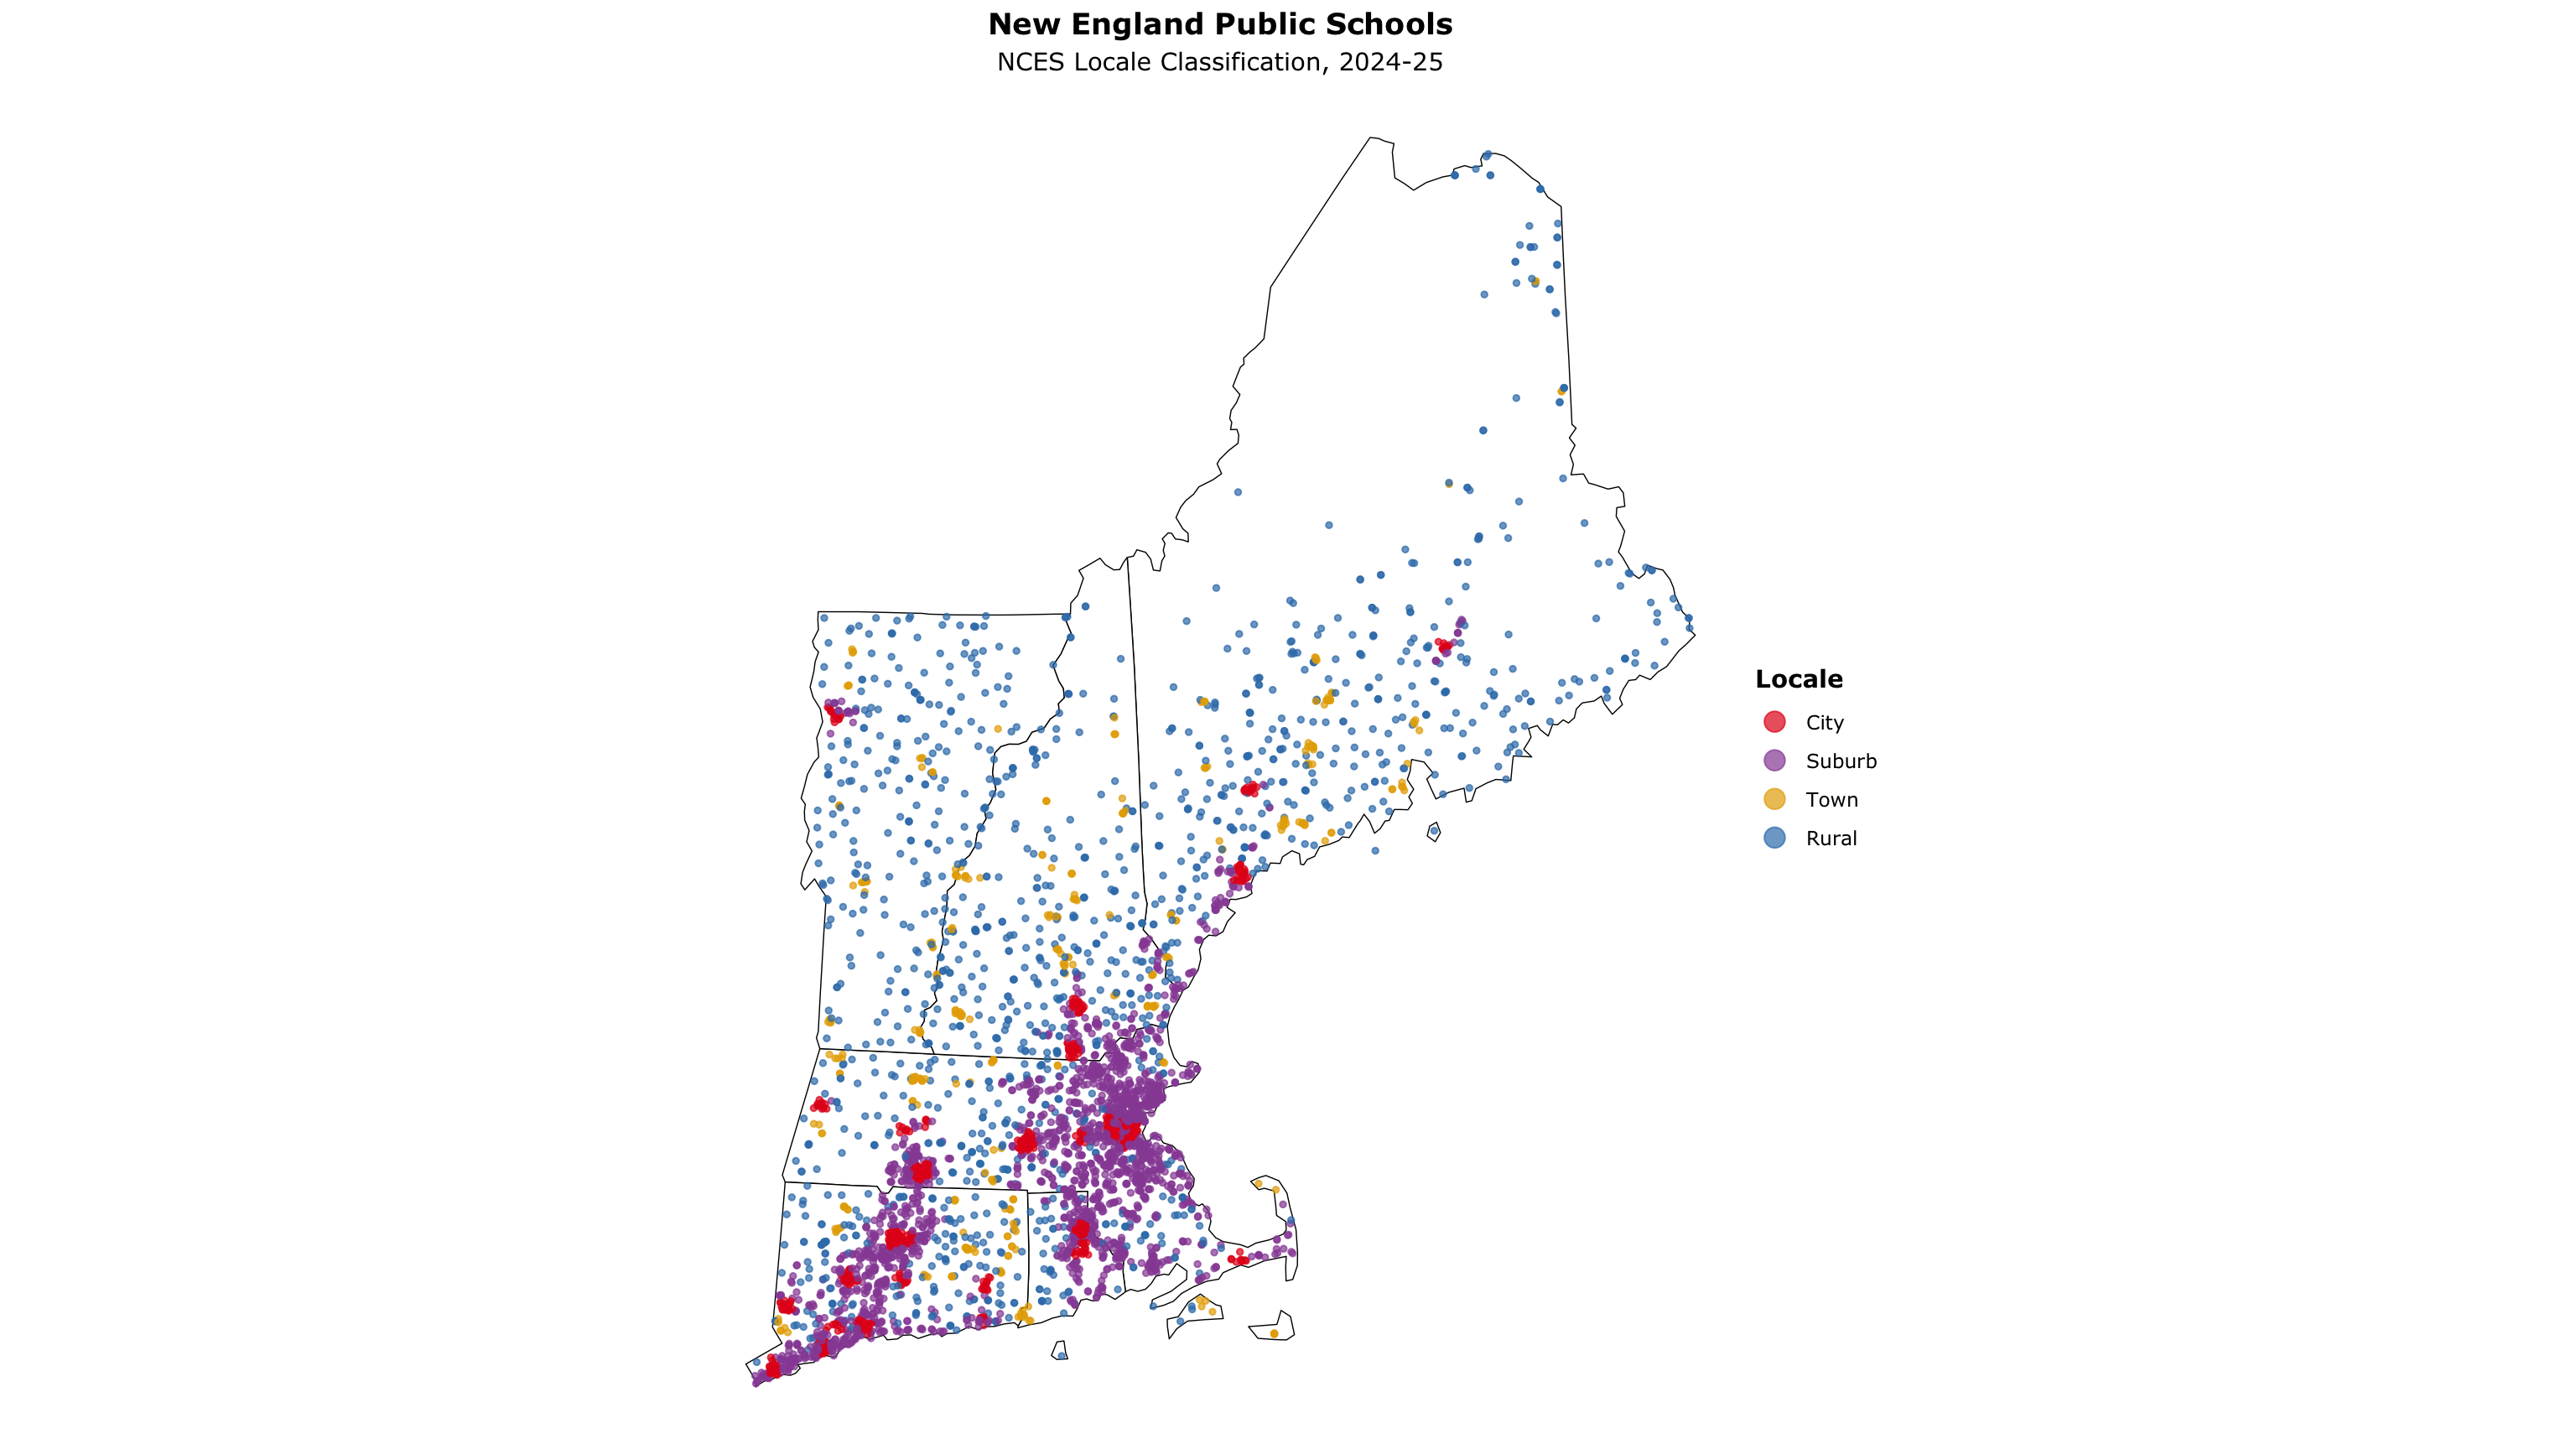
Public Schools by Locale
ggplot() +
  geom_sf(data = ne_sf, fill = "white", color = "black", linewidth = .25) +
  geom_sf(data = schools_sf, aes(color = locale), size = 1, alpha = .7) +
  scale_color_manual(values = c("#e41a1c", "#984ea3", "#e6ab02", "#377eb8"), name = "Locale") +
  coord_sf(crs = ne_crs) +
  theme_void(base_family = "Verdana") +
  theme(legend.title = element_text(face = "bold"),
        plot.subtitle = element_text(hjust = .5),
        plot.title = element_text(face = "bold", hjust = .5)) +
  guides(color = guide_legend(override.aes = list(size = 4))) +
  labs(title = "New England Public Schools",
       subtitle = "NCES Locale Classification, 2024-25")
Public Schools by Locale
Categorical Point Maps with mapgl
grocery_stores <- read_csv("https://andrewvanleuven.github.io/bostonfed_neppc/data/grocery_stores.csv") %>%
  st_as_sf(wkt = "geometry_wkt", crs = 4326) %>%
  mutate(tooltip = glue("<b>{name}</b><br>{city_name}, {state}"))

grocers <- c("Market Basket", "Hannaford", "Stop & Shop", "Shaw's", "Price Chopper")
grocer_colors <- c("#c8102e", "#5a8f29", "#6c2c91", "#0072ce", "#f39200")

maplibre(style = carto_style("positron"), bounds = ne_sf) %>%
  add_circle_layer(
    id = "poi-grocery", source = grocery_stores,
    circle_color = match_expr("name", values = grocers, stops = grocer_colors),
    circle_radius = 5, circle_stroke_color = "#ffffff",
    circle_stroke_width = .6, circle_opacity = 0.85, tooltip = "tooltip"
  ) %>%
  add_line_layer(id = "states", source = ne_sf, line_width = .5) %>%
  add_categorical_legend(
    legend_title = "New England Supermarket Chains",
    values = grocers, colors = grocer_colors,
    patch_shape = "circle", position = "bottom-right",
    layer_id = "poi-grocery", interactive = TRUE
)Categorical Point Maps with mapgl
Dunkin’ vs. Starbucks
coffee_shops <- read_csv("https://andrewvanleuven.github.io/bostonfed_neppc/data/coffee_shops.csv") %>%
  st_as_sf(wkt = "geometry_wkt", crs = 4326) %>%
  mutate(tooltip = glue("<b>{name}</b><br>{city_name}, {state}"))

maplibre(style = carto_style("positron"), bounds = ne_sf) %>%
  add_circle_layer(
    id           = "poi-coffee",
    source       = coffee_shops,
    circle_color = match_expr(
      "name",
      values = c("Dunkin'", "Starbucks"),
      stops  = c("#FF671F", "#00704A")
    ),
    circle_radius       = 4,
    circle_stroke_color = "white",
    circle_stroke_width = .4,
    circle_opacity      = 0.8,
    tooltip             = "tooltip"
  ) %>%
  add_categorical_legend(
    legend_title = "Coffee Chains",
    values       = c("Dunkin'", "Starbucks"),
    colors       = c("#FF671F", "#00704A"),
    patch_shape  = "circle",
    position     = "bottom-right",
    layer_id     = "poi-coffee",
    interactive  = TRUE
)Dunkin’ vs. Starbucks
st_intersection: Points in Polygons
town_pop_2020 <- map_dfr(ne_states, \(st) get_decennial(
  geography = "county subdivision", state = st,
  variables = "P1_001N", year = 2020, geometry = TRUE
)) %>%
  filter(value > 0) %>%
  st_transform(ne_crs) %>%
  select(town_id = GEOID, town = NAME, pop20 = value)

dunkin_by_town <- coffee_shops %>%
  filter(name == "Dunkin'") %>%
  st_transform(ne_crs) %>%
  st_intersection(town_pop_2020) %>%
  st_drop_geometry() %>%
  count(town_id, name = "dunkins")

dunkin_sf <- town_pop_2020 %>%
  left_join(dunkin_by_town, by = "town_id") %>%
  replace_na(list(dunkins = 0)) %>%
  mutate(dunkins_per_10k = dunkins / pop20 * 10000)
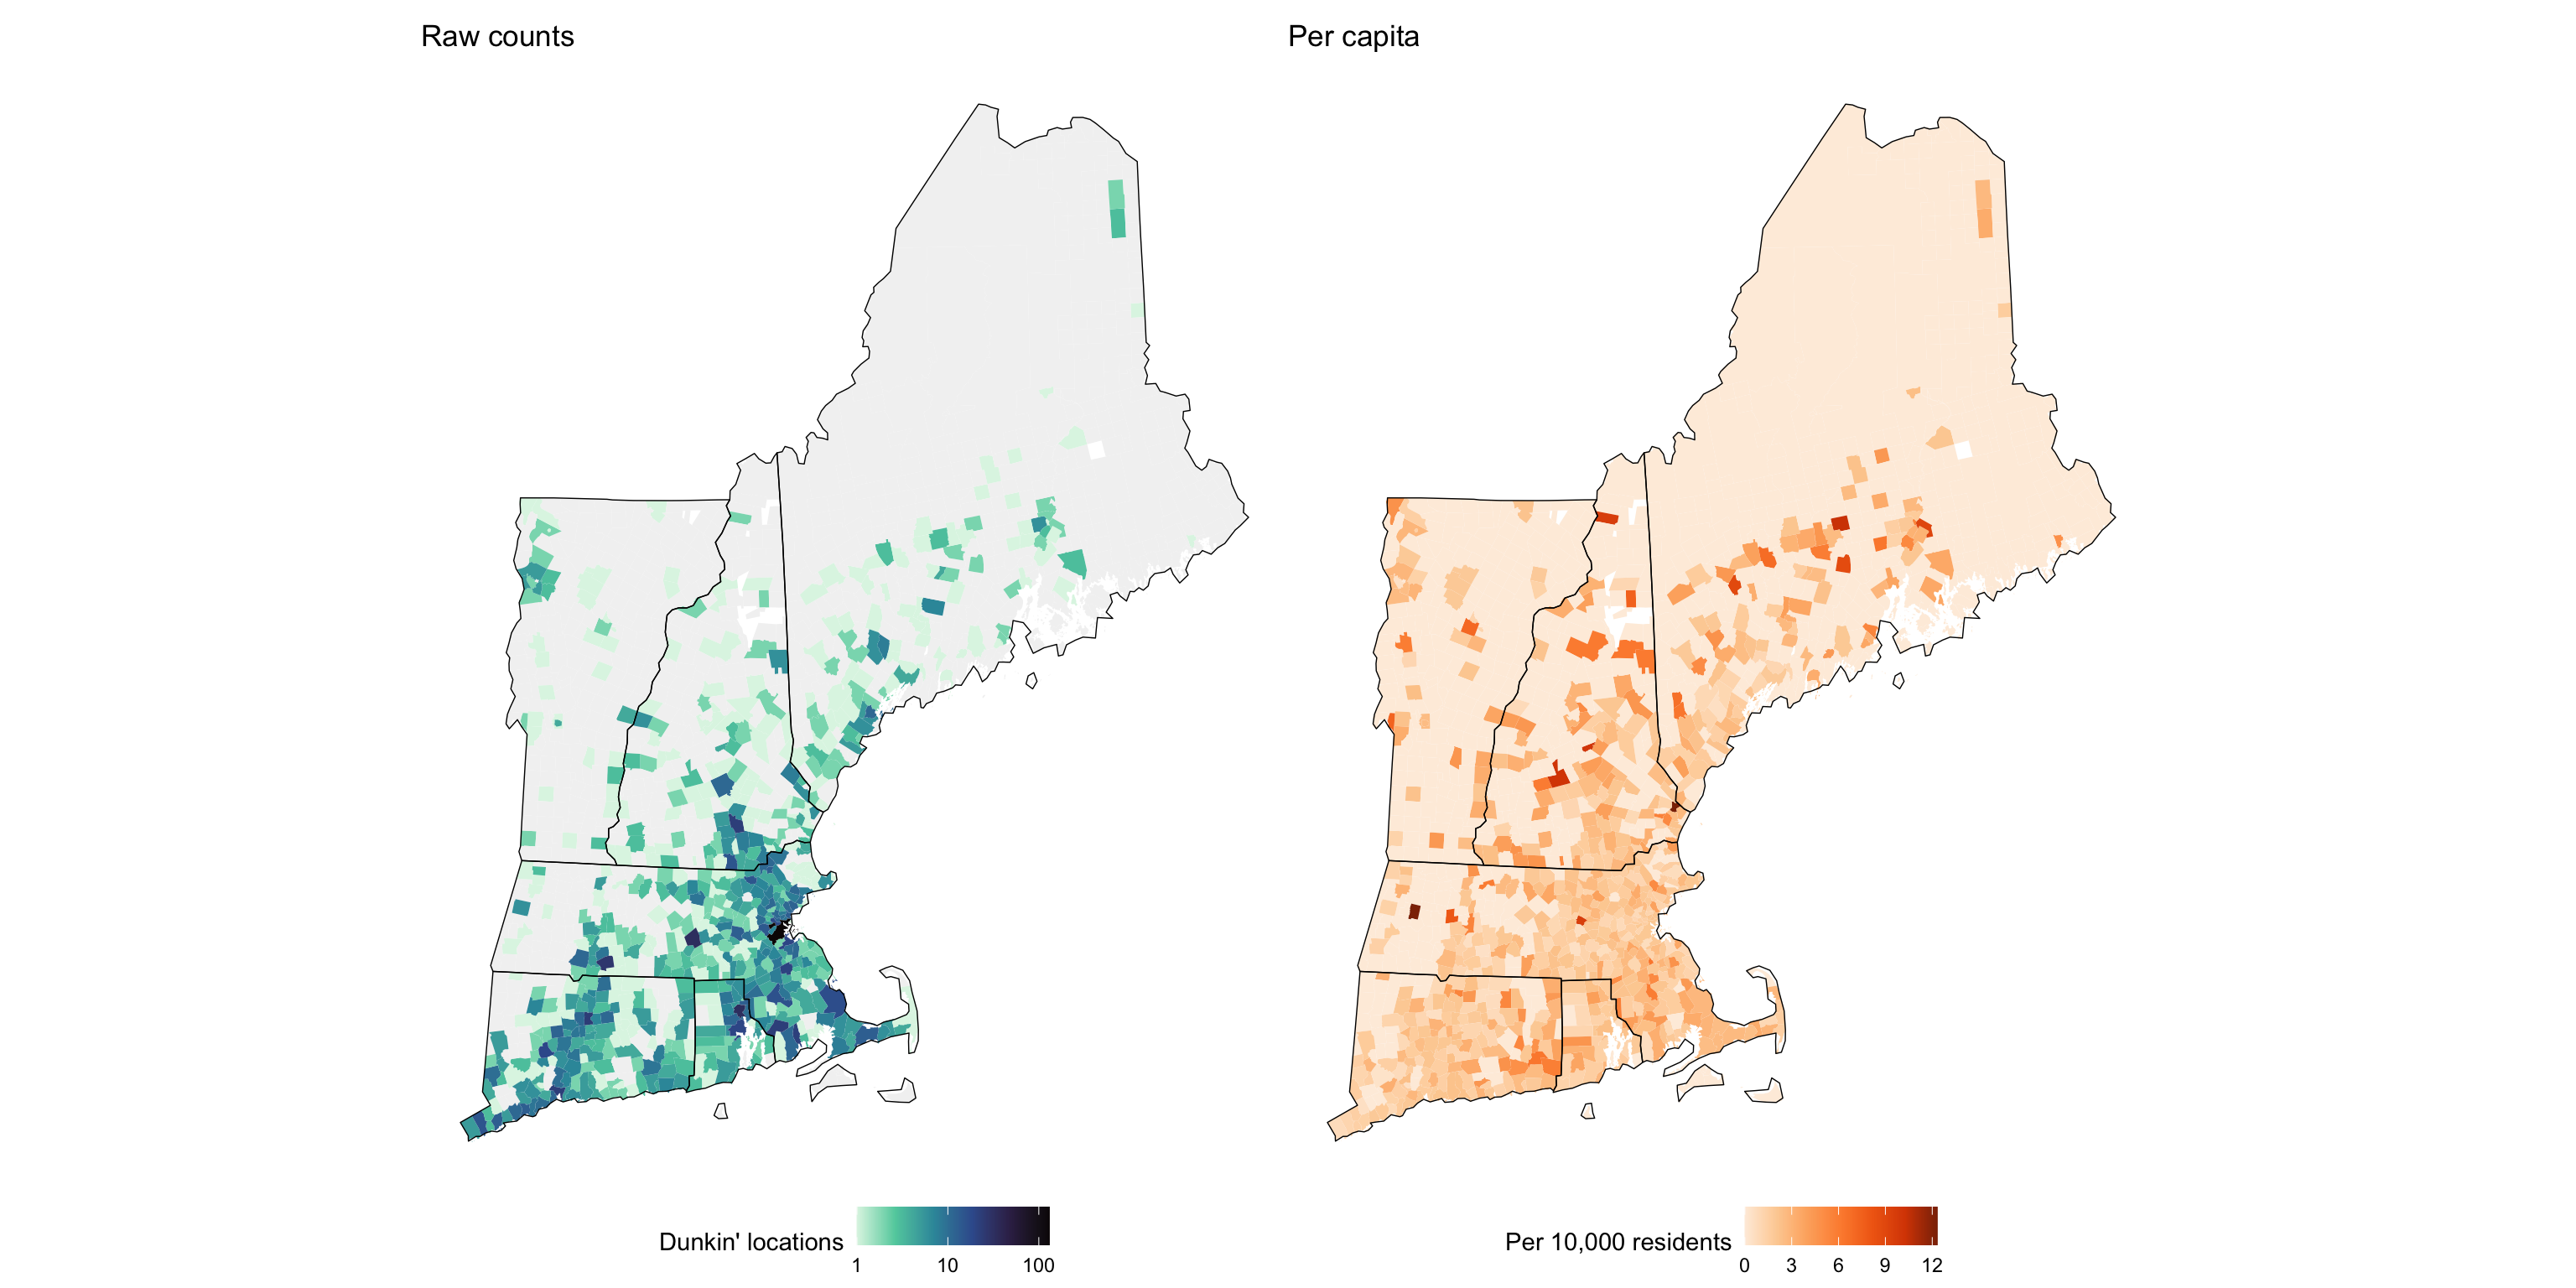
Raw Counts vs Per Capita
p1 <- ggplot() +
  geom_sf(data = dunkin_sf, aes(fill = dunkins), color = NA) +
  geom_sf(data = ne_sf, color = "black", linewidth = .25, fill = NA) +
  coord_sf(crs = ne_crs) +
  scale_fill_viridis_c(option = "mako", name = "Dunkin' locations",
                       trans = "log10", direction = -1, na.value = "gray95") +
  theme_void() + theme(legend.position = "bottom") +
  labs(title = "Raw counts")

p2 <- ggplot() +
  geom_sf(data = dunkin_sf, aes(fill = dunkins_per_10k), color = NA) +
  geom_sf(data = ne_sf, color = "black", linewidth = .25, fill = NA) +
  coord_sf(crs = ne_crs) +
  scale_fill_distiller(palette = "Oranges", name = "Per 10,000 residents",
                       direction = 1, na.value = "white") +
  theme_void() + theme(legend.position = "bottom") +
  labs(title = "Per capita")

p1 + p2
Raw Counts vs Per Capita
Buffer Analysis: st_buffer
maine_grocery_buffers <- grocery_stores %>%
  filter(state == "ME") %>%
  st_transform(26919) %>%
  st_buffer(10 * 1609.34) %>%
  st_transform(4326)

maplibre(bounds = filter(ne_sf, STUSPS == "ME"),
         style = carto_style("positron")) %>%
  add_fill_layer(
    id = "buffers", source = maine_grocery_buffers,
    fill_color = "#202020", fill_opacity = 0.4
  )
st_buffer() creates a polygon a fixed distance around each point. CRS 26919 (UTM zone 19N) uses meters, so 10 miles = 16,093 meters.
Buffer Analysis: st_buffer
From Dense Points to Heatmap
ma_dunkin <- coffee_shops %>%
  filter(state == "MA", name == "Dunkin'") %>%
  st_jitter(factor = 0.0001)

maplibre(style = carto_style("positron"),
         bounds = filter(ne_sf, STUSPS == "MA")) %>%
  add_circle_layer(
    id = "poi-dunkin", source = ma_dunkin,
    circle_color = "#FF671F", circle_stroke_color = "white", circle_stroke_width = 1
  ) %>%
  add_heatmap_layer(
    id = "heatmap", source = ma_dunkin, heatmap_radius = 25,
    heatmap_color = interpolate(
      property = "heatmap-density", values = seq(0, 1, 0.2),
      stops = c("transparent", magma(5))
    )
  )
From Dense Points to Heatmap
More Things sf Can Do
st_distance()        # distance between features (in CRS units)
st_nearest_feature() # index of the nearest feature in another layer
st_centroid()        # geometric center of a polygon
st_area()            # area of a polygon (in CRS units)
st_union()           # merge / dissolve geometries into one
st_bbox()            # bounding box of a layer
st_crop()            # clip features to a rectangular extent
st_within()          # is feature A fully inside feature B?
st_touches()         # do features share a boundary?
sf cheat sheet: rstudio.github.io/cheatsheets/sf.pdf
More Examples of Spatial Data Visualization in R
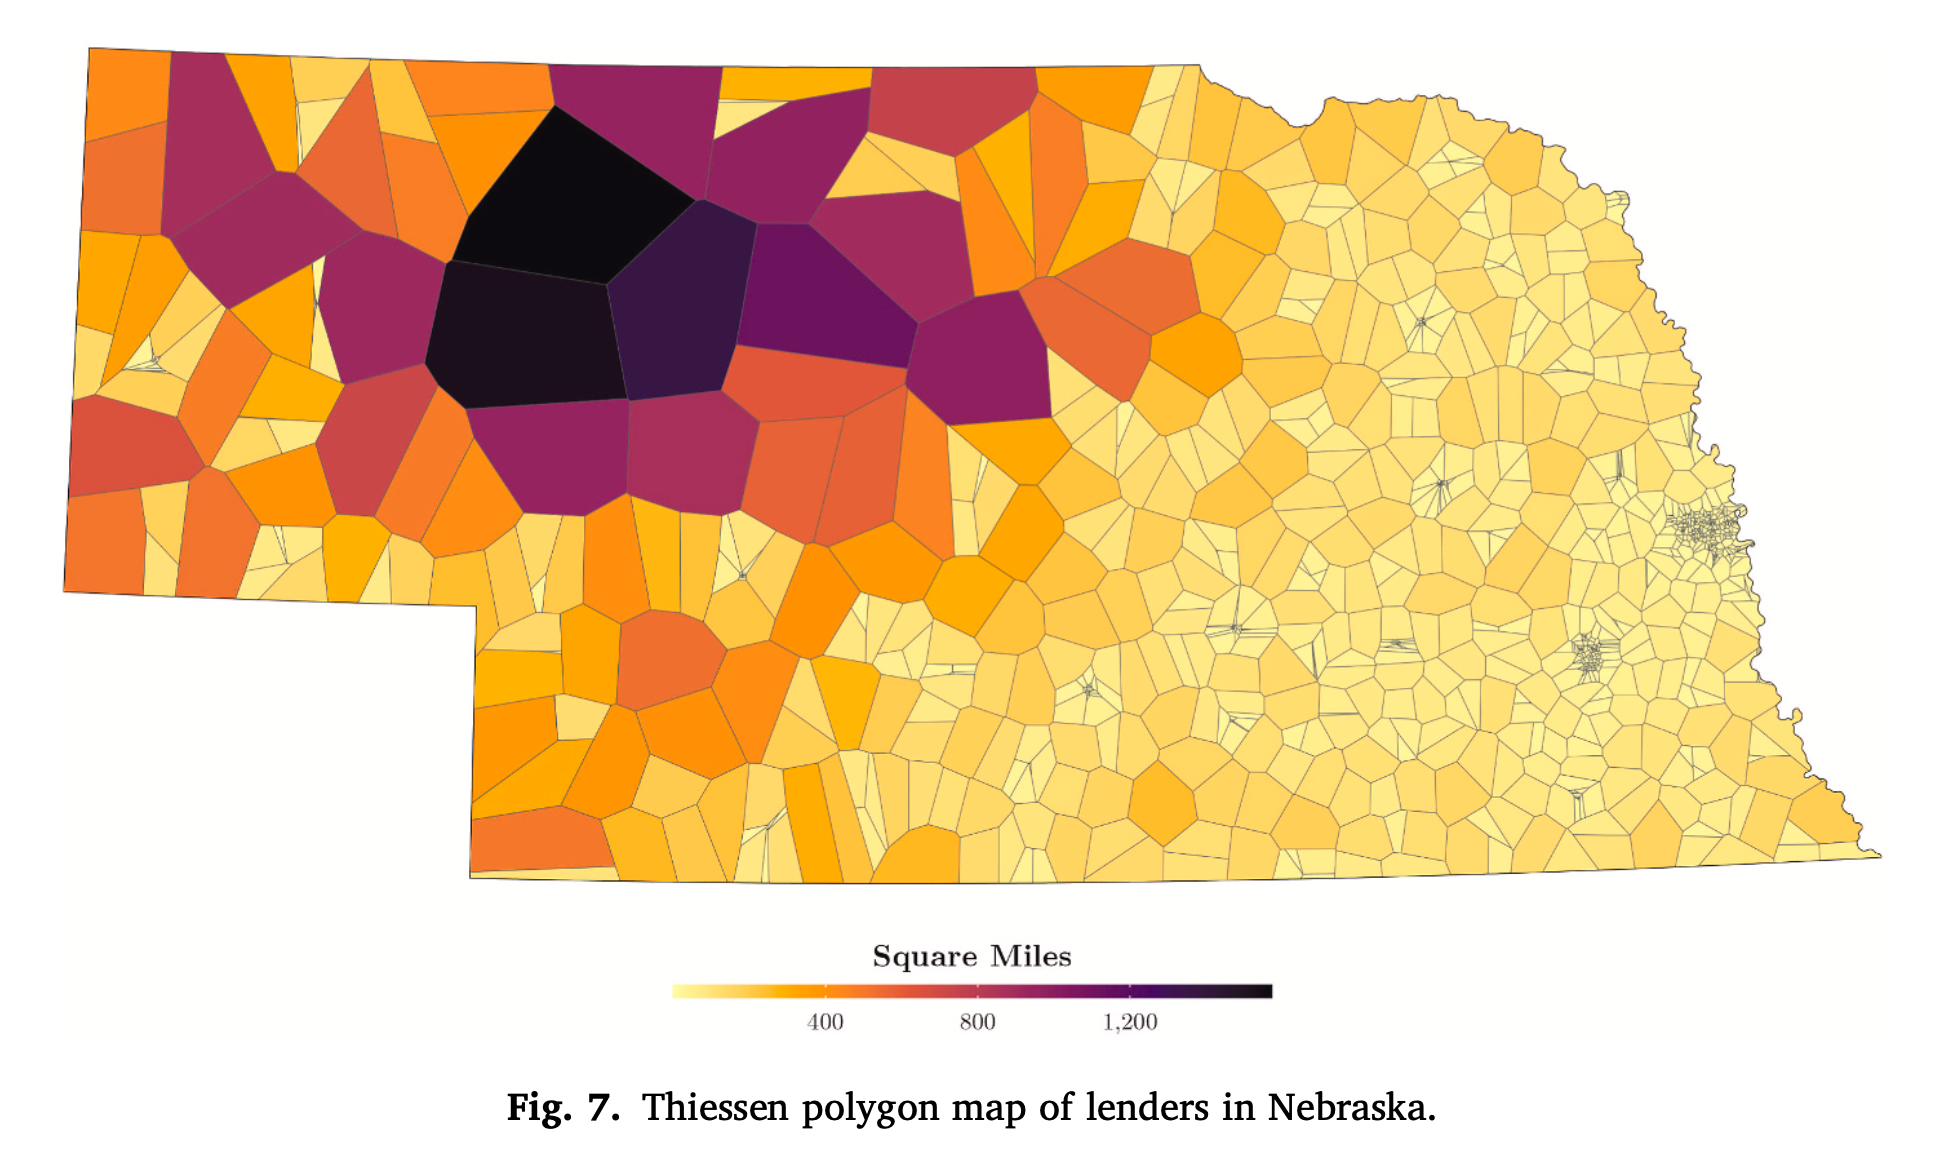
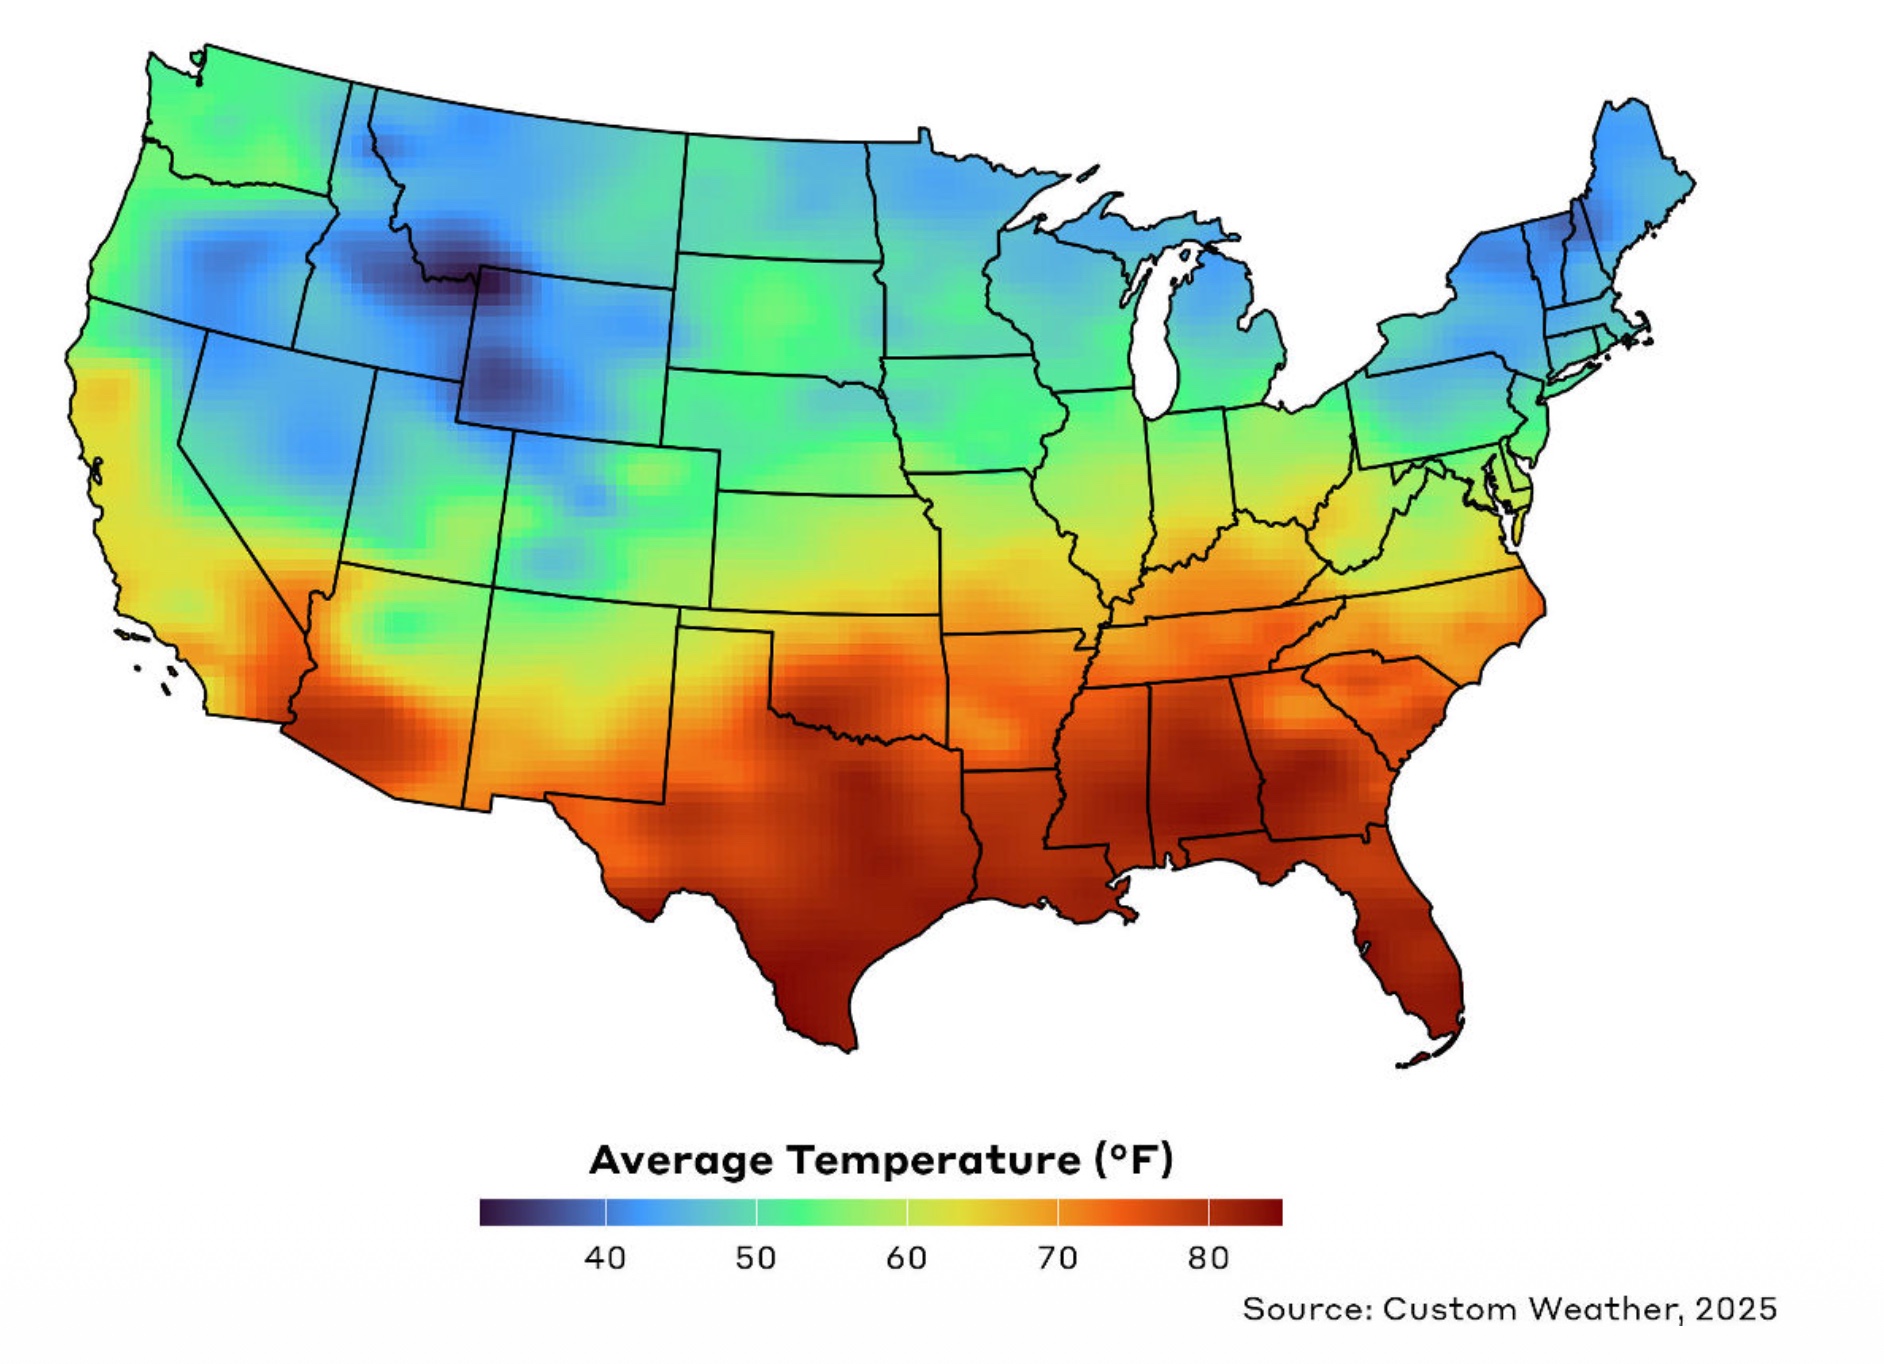
More Examples of Spatial Data Visualization in R
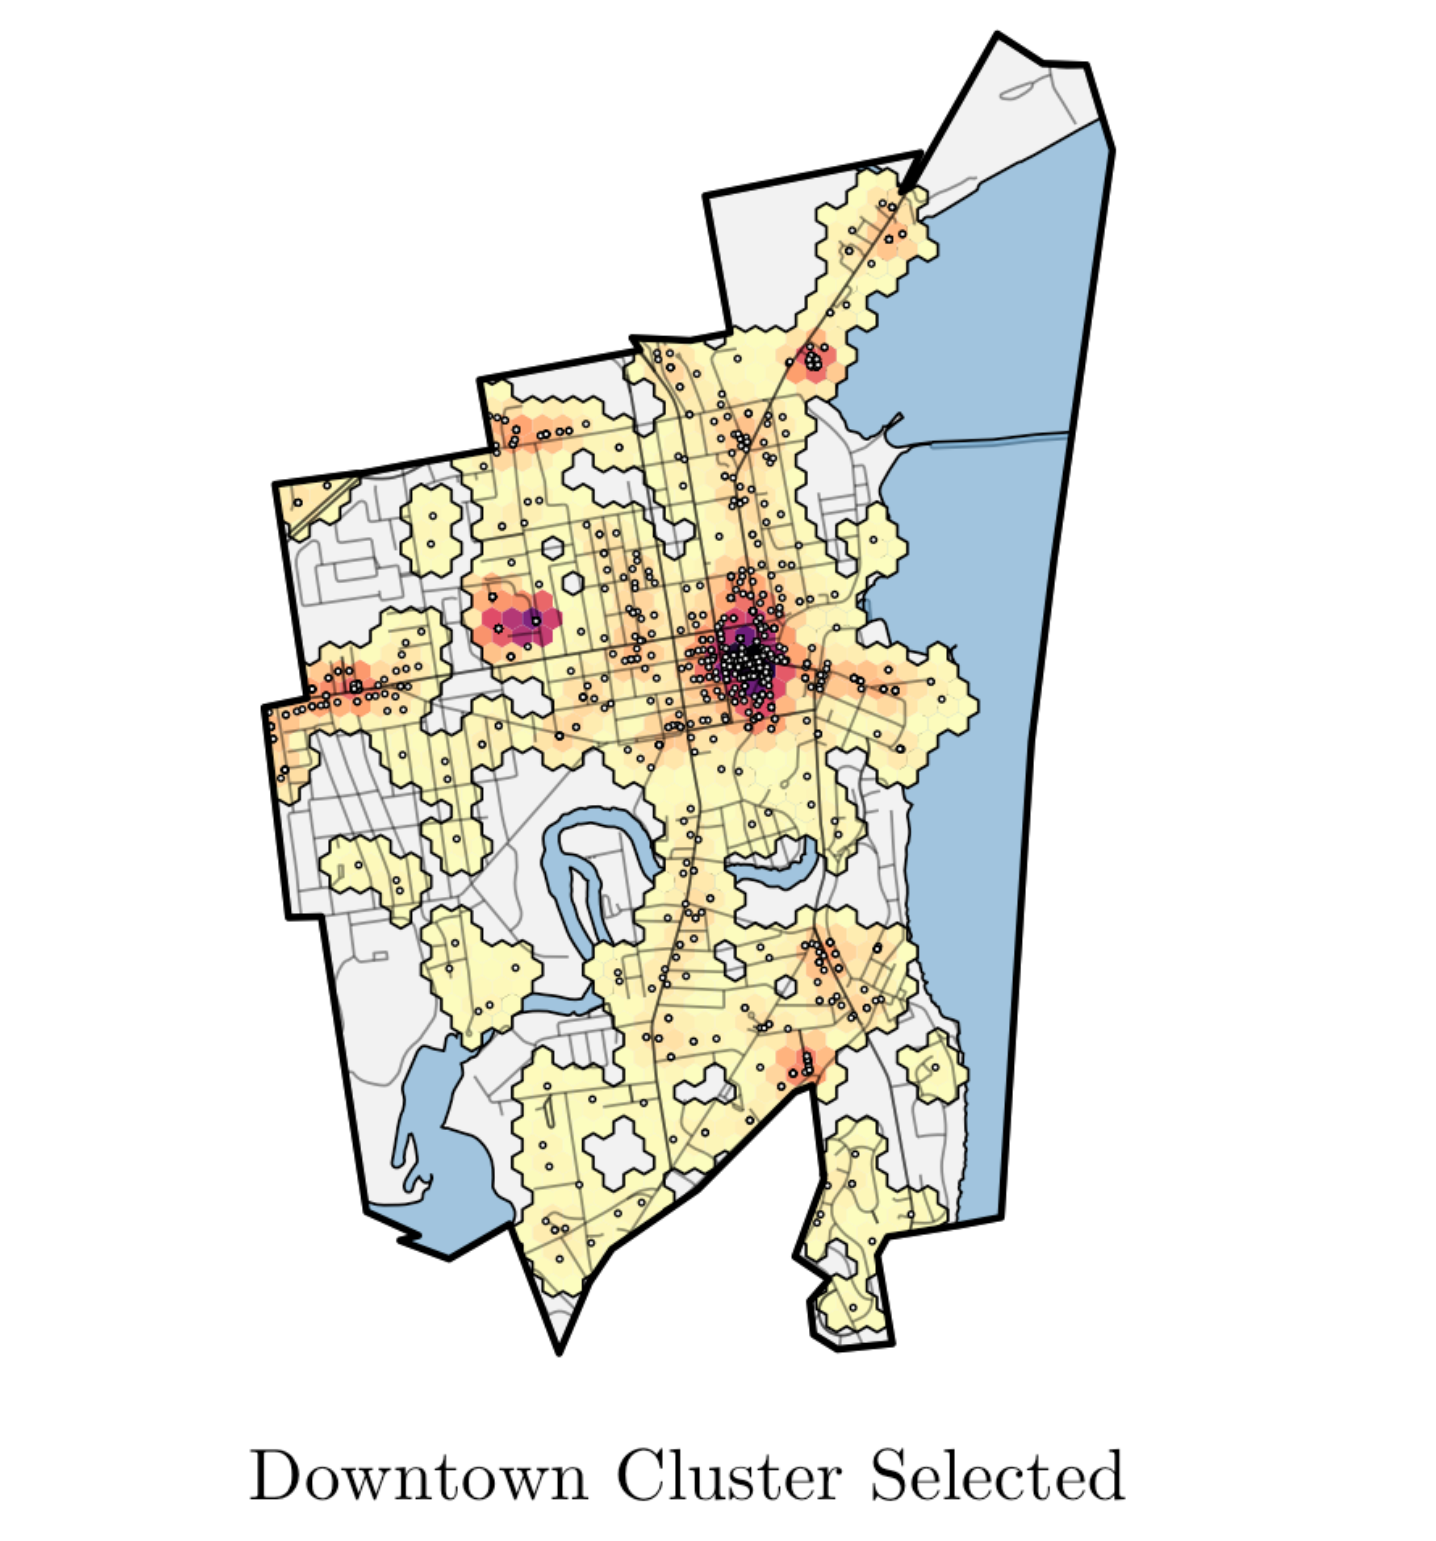
More Examples of Spatial Data Visualization in R
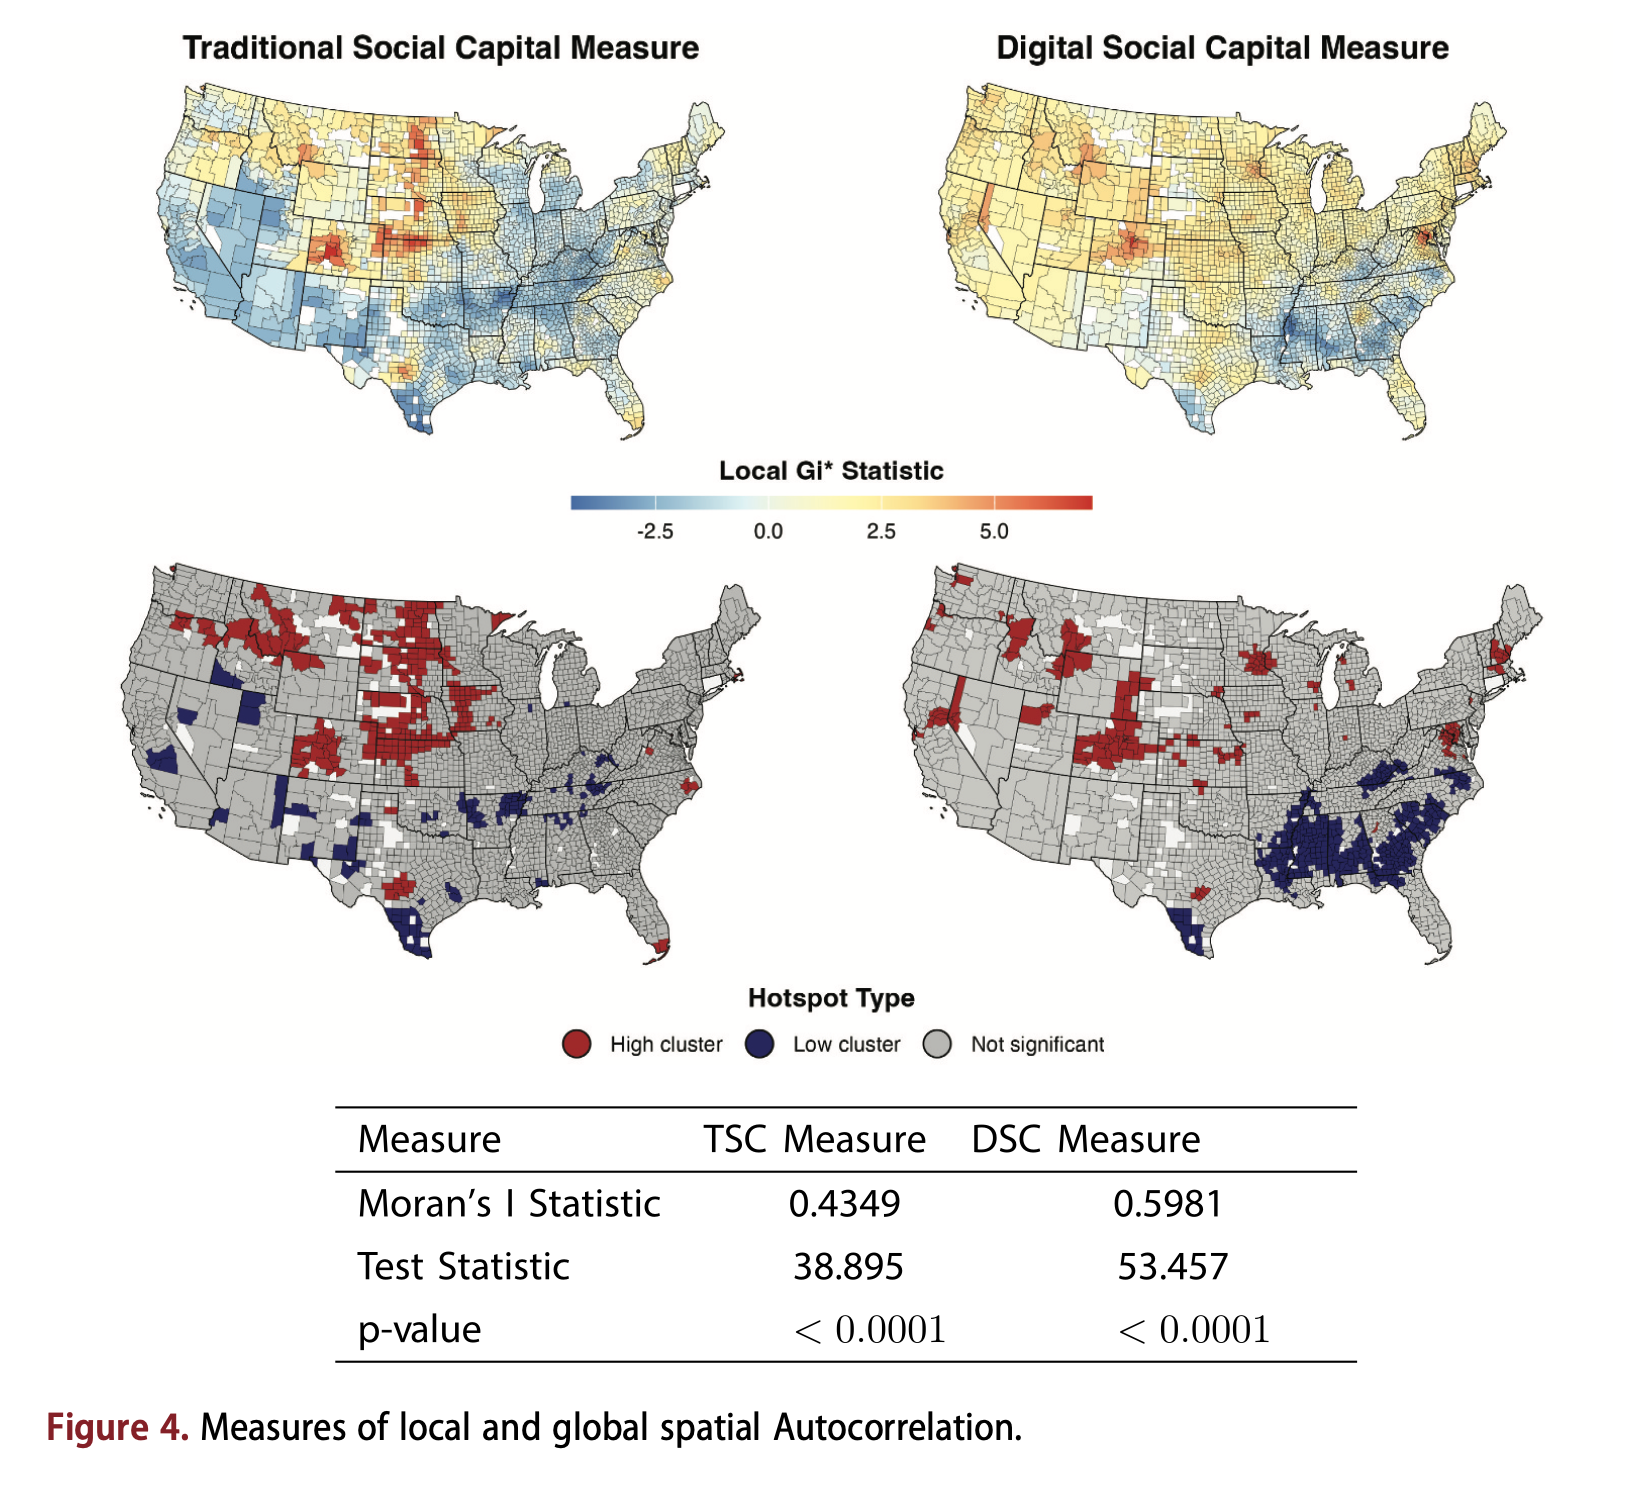
More Examples of Spatial Data Visualization in R
Wrap Up
What We Covered
- Mapping basics: vector vs. raster data, coordinate reference systems, map types
- ggplot2 maps:
tigrisfor boundaries,geom_sf(), projections, color scales, choropleth maps - Census data:
tidycensuswith geometry, counties to tracts to towns, Connecticut’s planning regions, classification breaks, side-by-side map comparison - Point data and GIS operations:
st_as_sf(), categorical styling, spatial joins, counts vs. rates, buffer analysis, heatmaps
Thank You
Andrew Van Leuven University of Vermont
Questions?
Introduction to Maps | Andrew Van Leuven