states_sf <- states(cb = TRUE, resolution = "20m") %>%
filter(!STUSPS %in% c("AK", "HI", "PR", "VI", "GU", "AS", "MP"))
counties_sf <- counties(cb = TRUE, resolution = "20m") %>%
filter(!STATEFP %in% c("02", "15", "72", "78", "66", "60", "69"))Introduction to Maps
USDA AMS/AAEA GSS Local Food Economics Data Visualization Challenge
Andrew Van Leuven | University of Vermont
June 4, 2026
Follow Along
Scan to download the R script used in today’s demo:

GitHub Link: https://github.com/andrewvanleuven/andrewvanleuven.github.io/blob/main/aaea_webinar/demo_script.R
Agenda
- Mapping basics
- Mapping in ggplot2
- Data from Census and NASS QuickStats
- Point data and basic GIS operations
Packages We’ll Use Today
install.packages(c(
"tidyverse", # data manipulation + ggplot2
"sf", # spatial data in R
"tigris", # US Census boundary files
"tidycensus", # Census + ACS data with geometry
"rnassqs", # NASS QuickStats API
"mapgl", # interactive web maps
"classInt", # natural breaks for color scales
"RColorBrewer" # color palettes
))Part 1: Mapping Basics
What Is GIS?
Geographic Information Systems = data + location
- Any dataset with a spatial component can be put on a map
- Agriculture is inherently spatial: counties, farms, markets, watersheds, supply chains
- Maps reveal patterns that tables and charts simply cannot
Today’s goal: get you from zero to a working map pipeline in R
Types of Spatial Data
Vector data (what we’ll use today)
| Type | Examples |
|---|---|
| Points | farmers markets, food hubs, farms |
| Lines | roads, rivers, rail corridors |
| Polygons | counties, states, ZIP codes |
Raster data (not today)
- A grid of cells, like a photo
- Elevation, land cover, satellite imagery
- Temperature, precipitation, and other climate variables
- Handled in R via
terra/stars
What Lives in an sf Object?
An sf data frame is just a regular data frame with one extra column: geometry
Simple feature collection with 3,234 features
Geometry type: MULTIPOLYGON
CRS: NAD83 (EPSG:4269)
GEOID NAME STATEFP ALAND geometry
1 01001 Autauga 01 1539602840 MULTIPOLYGON(...)
2 01003 Baldwin 01 4117521611 MULTIPOLYGON(...)
3 01005 Barbour 01 2291820706 MULTIPOLYGON(...)The geometry column is a list of all the coordinate pairs (longitude, latitude) that define each shape. For a polygon, it’s every vertex. For a point, it’s just one.
Coordinate Reference Systems
The earth is round. Maps are flat. Something has to give.
A CRS defines how 3D coordinates get projected onto a 2D surface.
Two CRS you’ll use constantly:
| CRS | EPSG | When you’ll see it |
|---|---|---|
| WGS84 | 4326 | GPS coordinates, GeoJSON files, web APIs, mapgl |
| Albers Equal Area | 5070 | Thematic maps in ggplot2 |
Rule of thumb: store and share data in 4326. Project to 5070 for any static map of the contiguous US.
Why Projections Matter

“Comparison of tangent and secant cylindrical, conic and azimuthal map projections” by cmglee et al., CC BY-SA 4.0, via Wikimedia Commons
Types of Maps
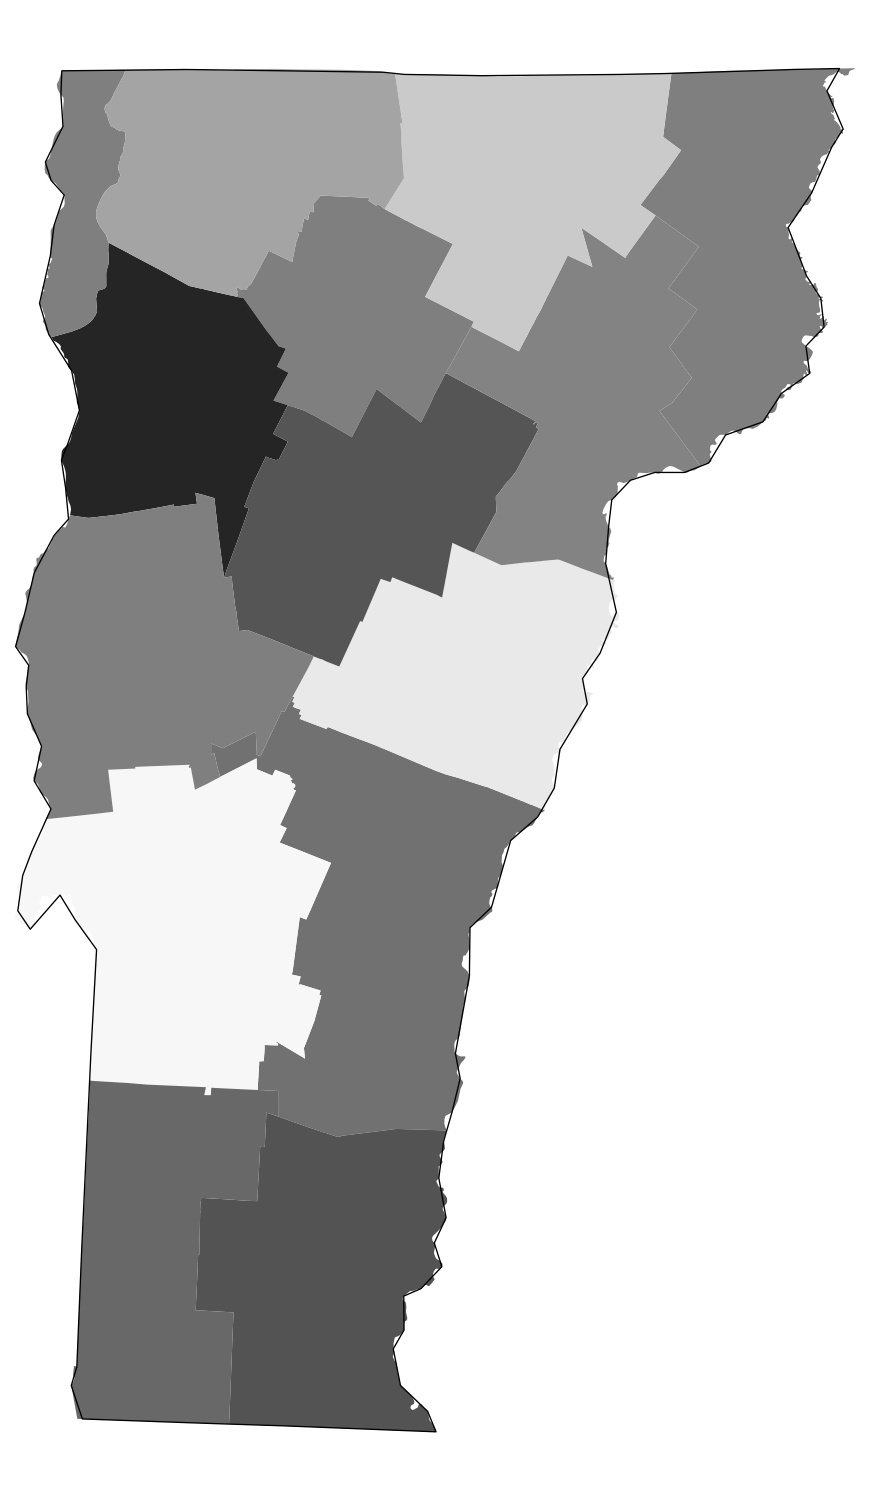
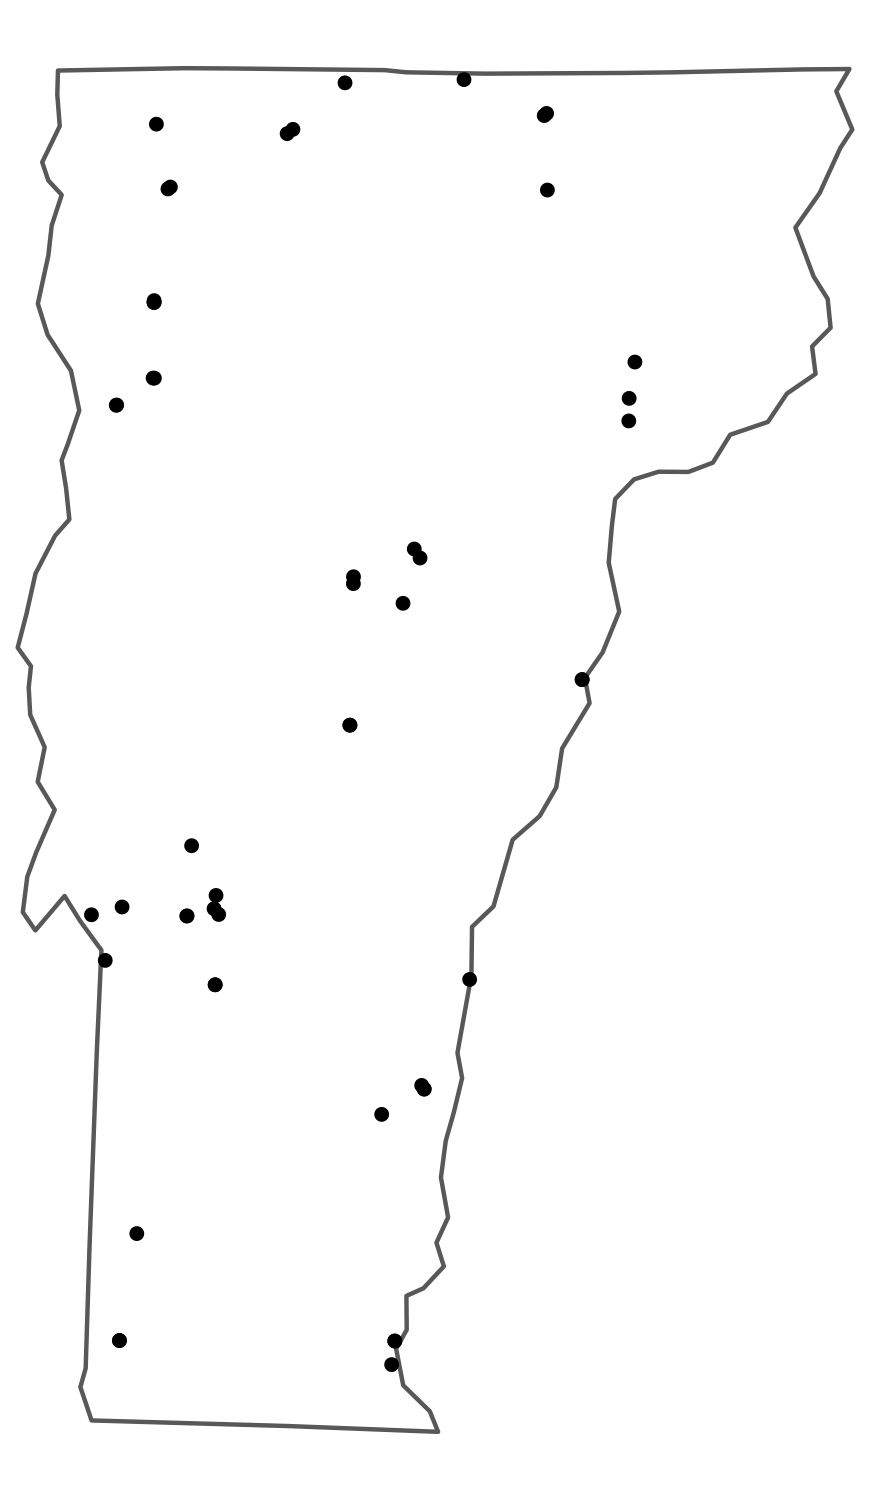
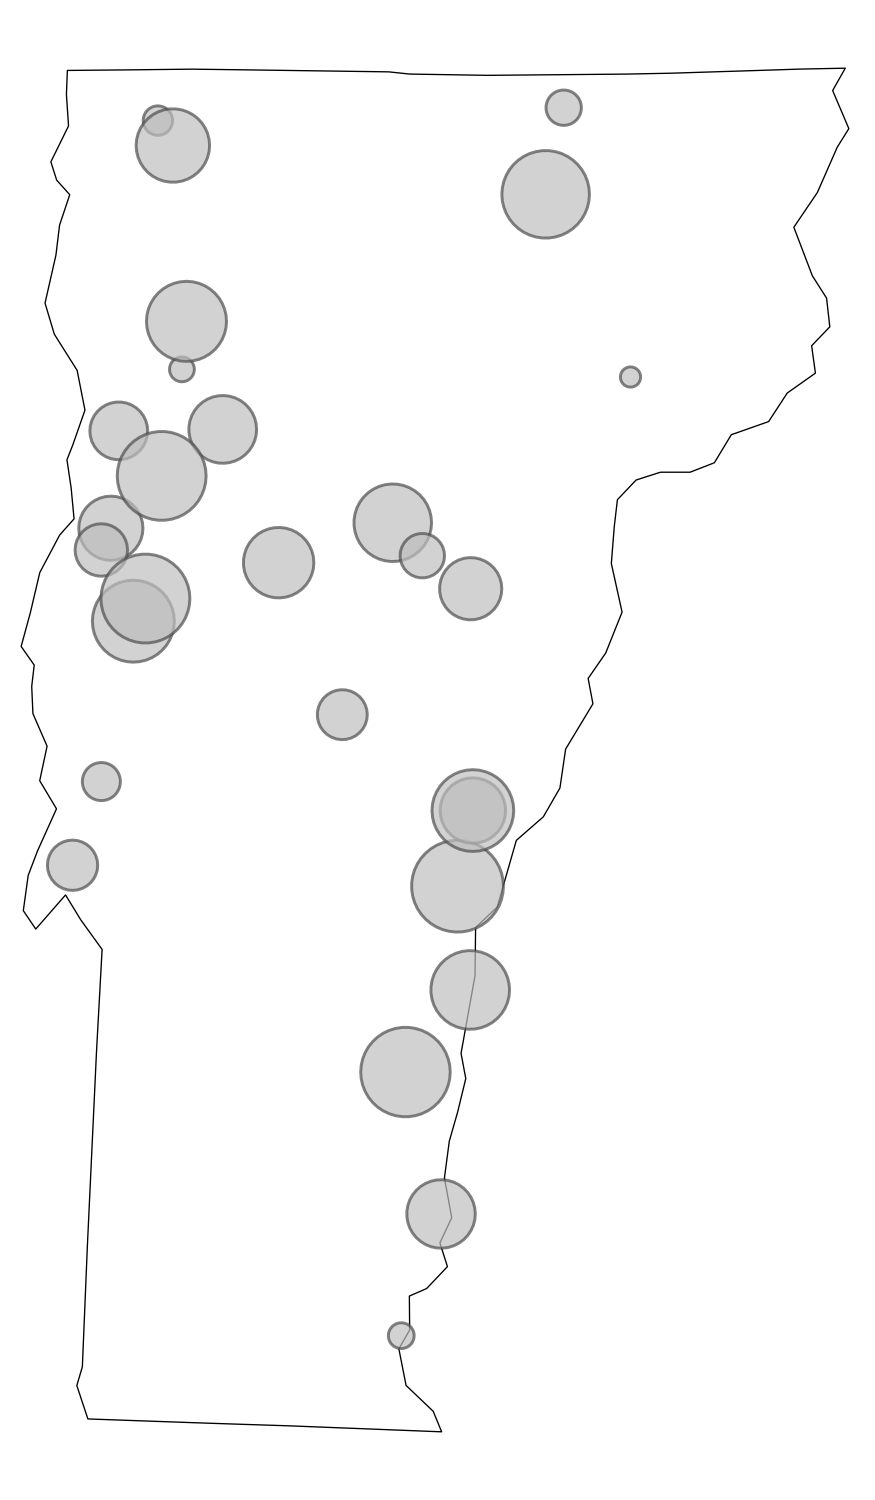
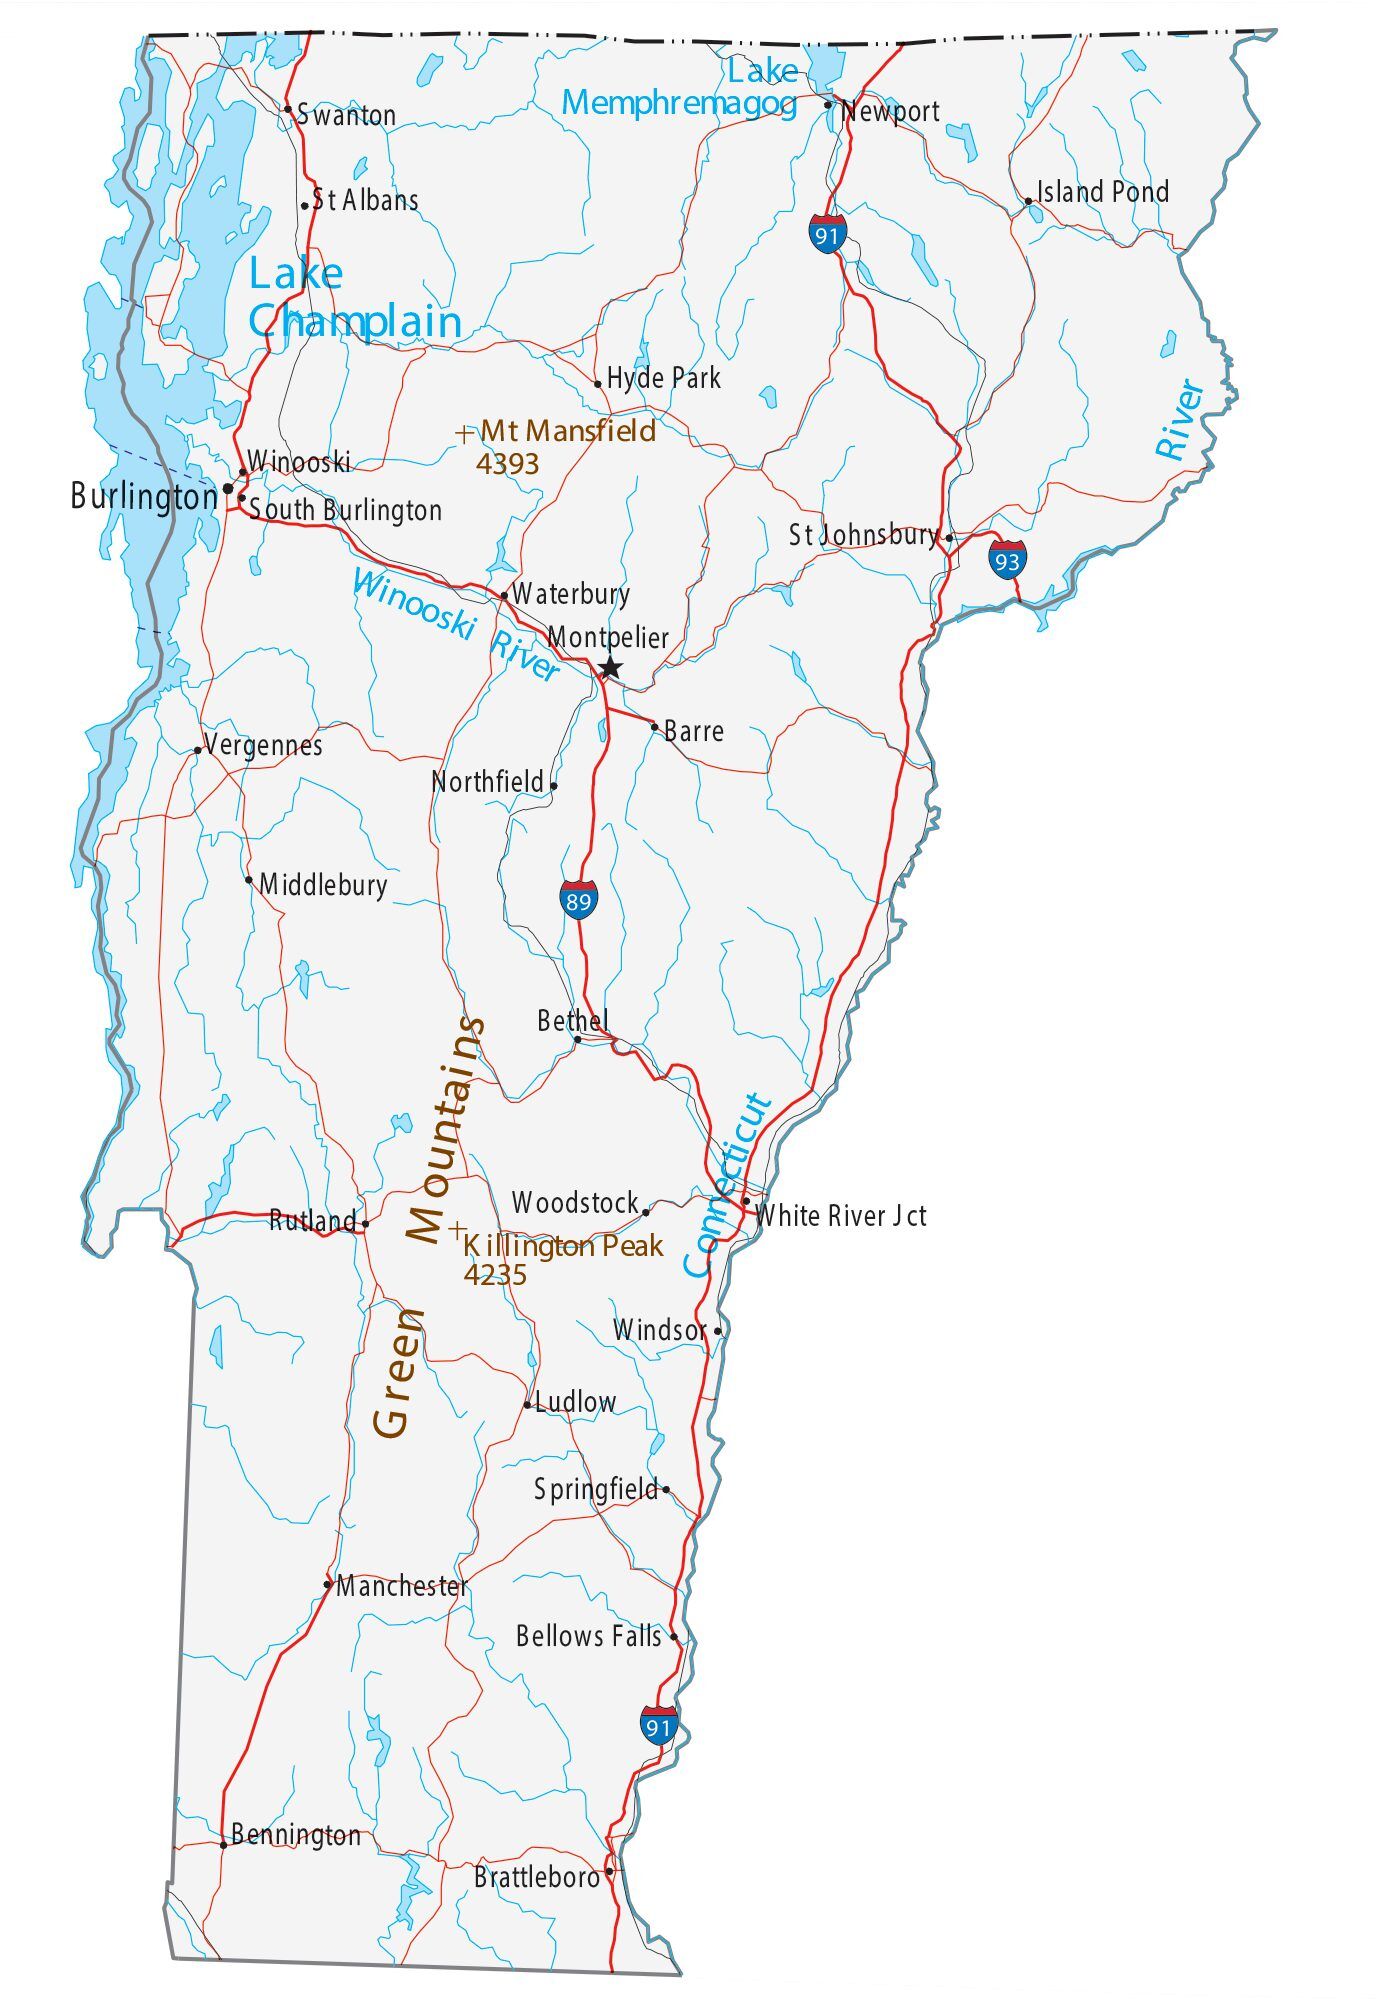
Choropleth: areas shaded by value
Dot map: one dot per unit
Proportional symbol: symbol size = quantity
Reference: orientation / context
Part 2: Mapping in ggplot2
Getting Boundary Data
- TIGER/Line files: the Census Bureau’s authoritative geographic boundary dataset, covering states, counties, tracts, roads, water features, and more
tigris: an R package that downloads TIGER/Line files directly from the Census API and returns them assfobjects, ready to map
cb = TRUE: simplified cartographic boundary (better for maps)resolution = "20m": 1:20,000,000 scale (right for national maps)- The filter removes Alaska, Hawaii, and territories
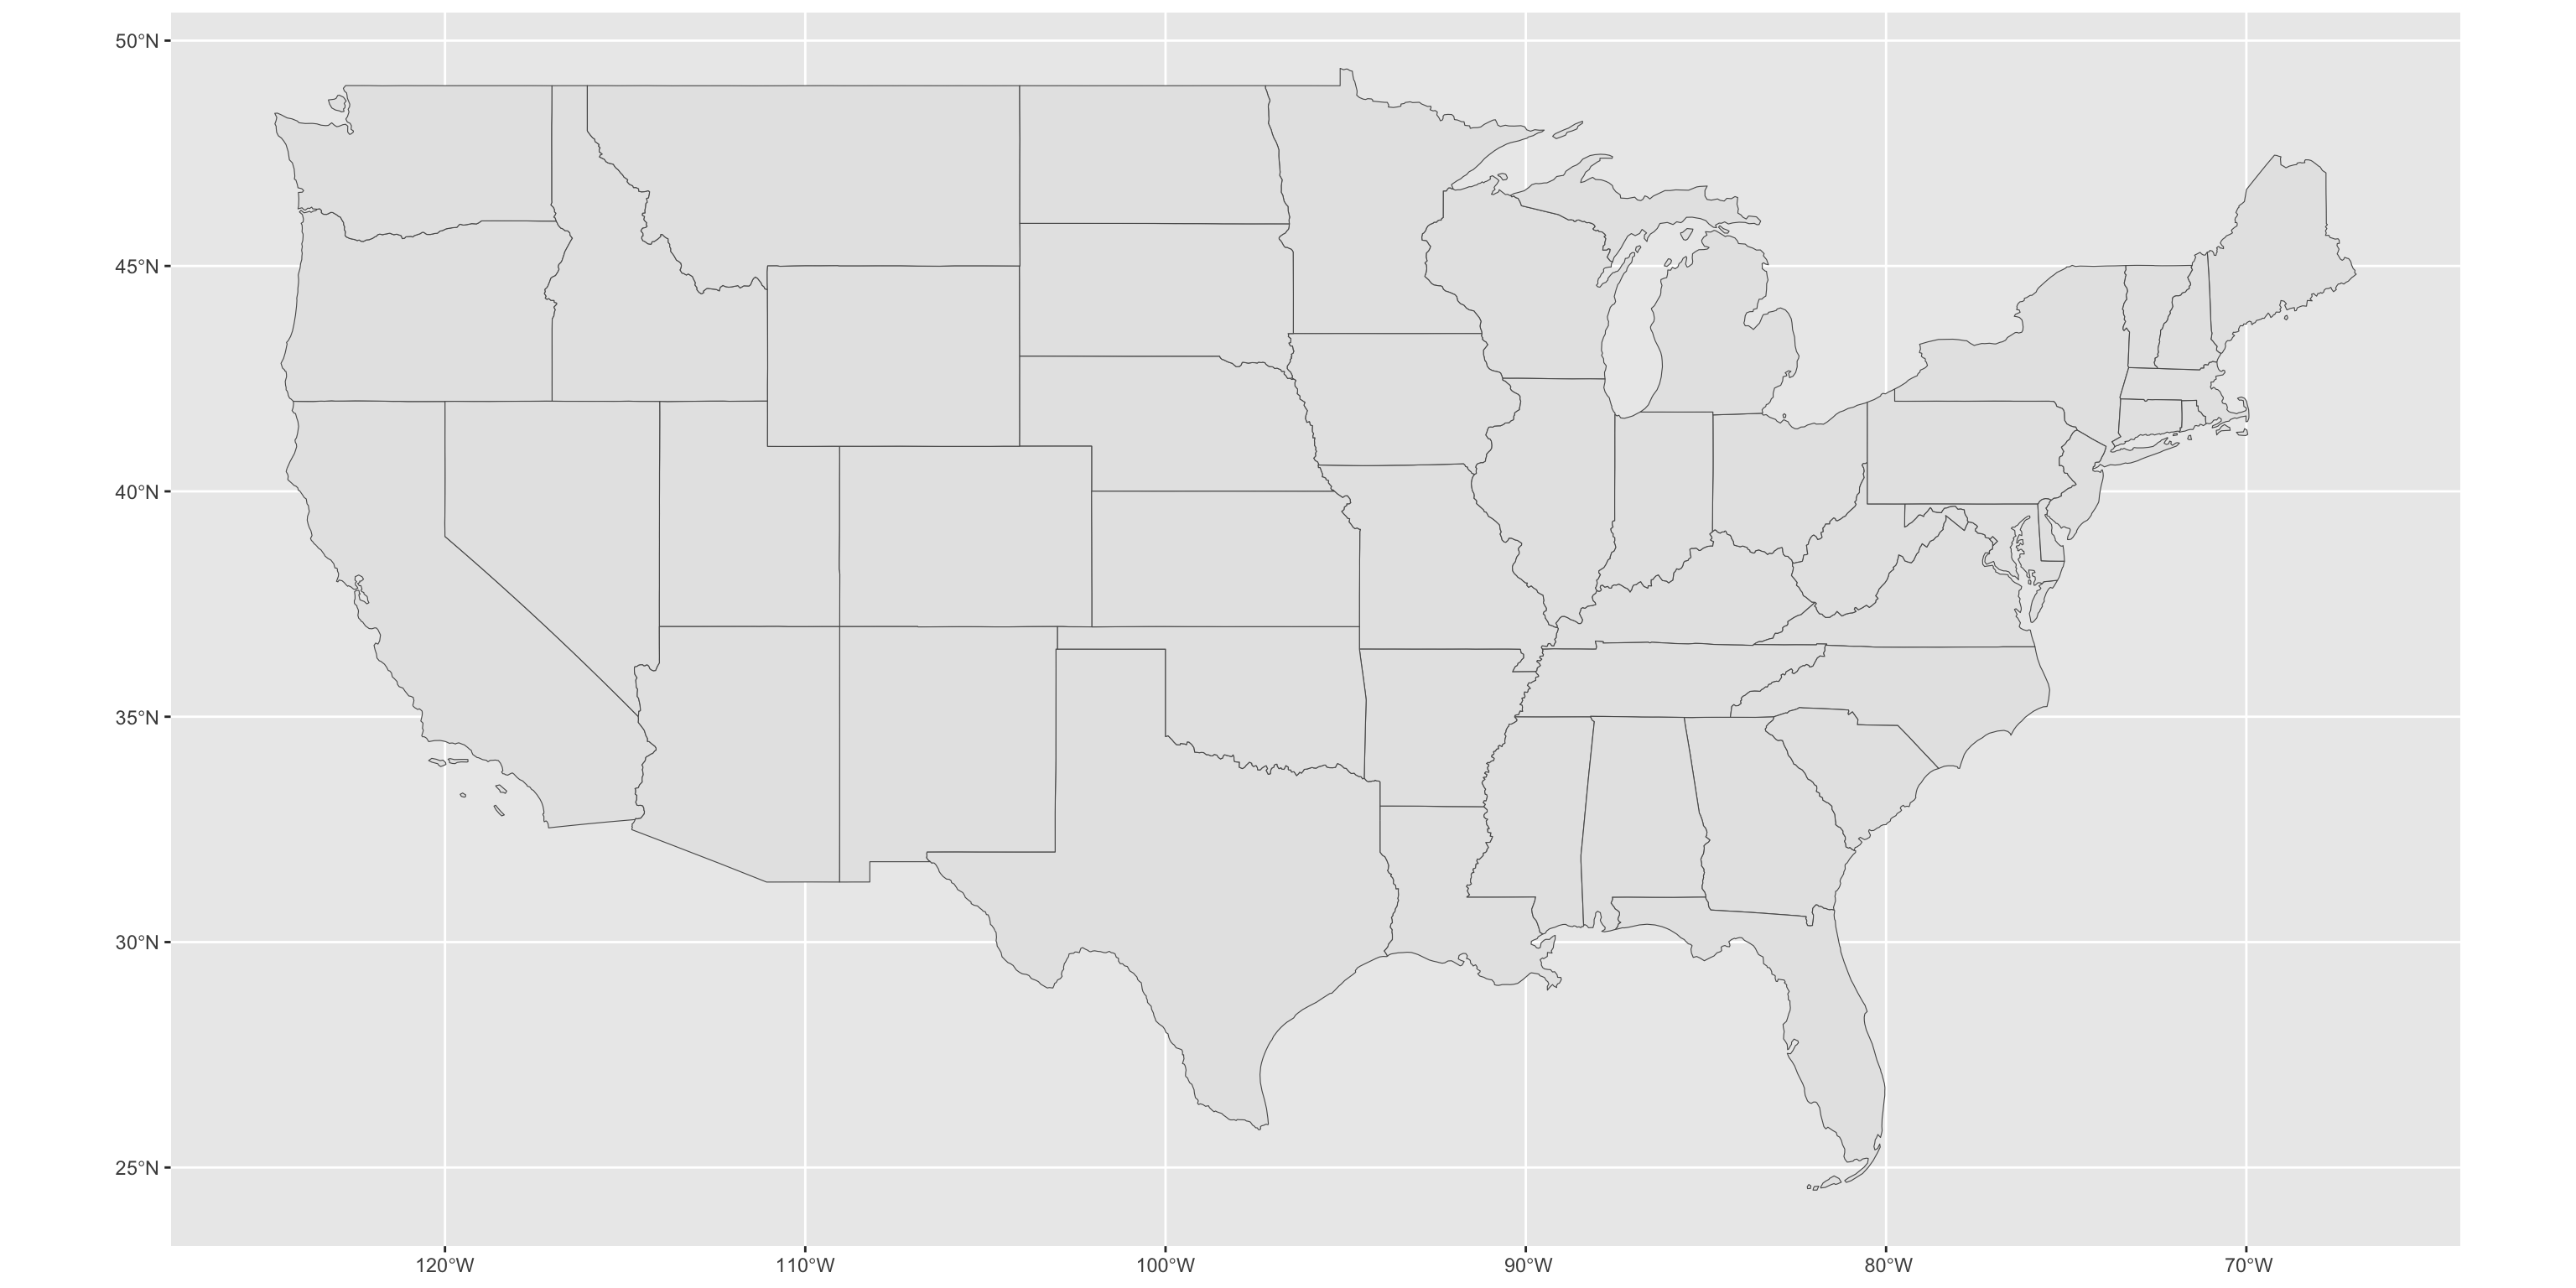
Your First Map
geom_sf() reads the geometry column and draws the shapes. But it looks flat and weird – let’s fix that.
Your First Map
Applying a Projection
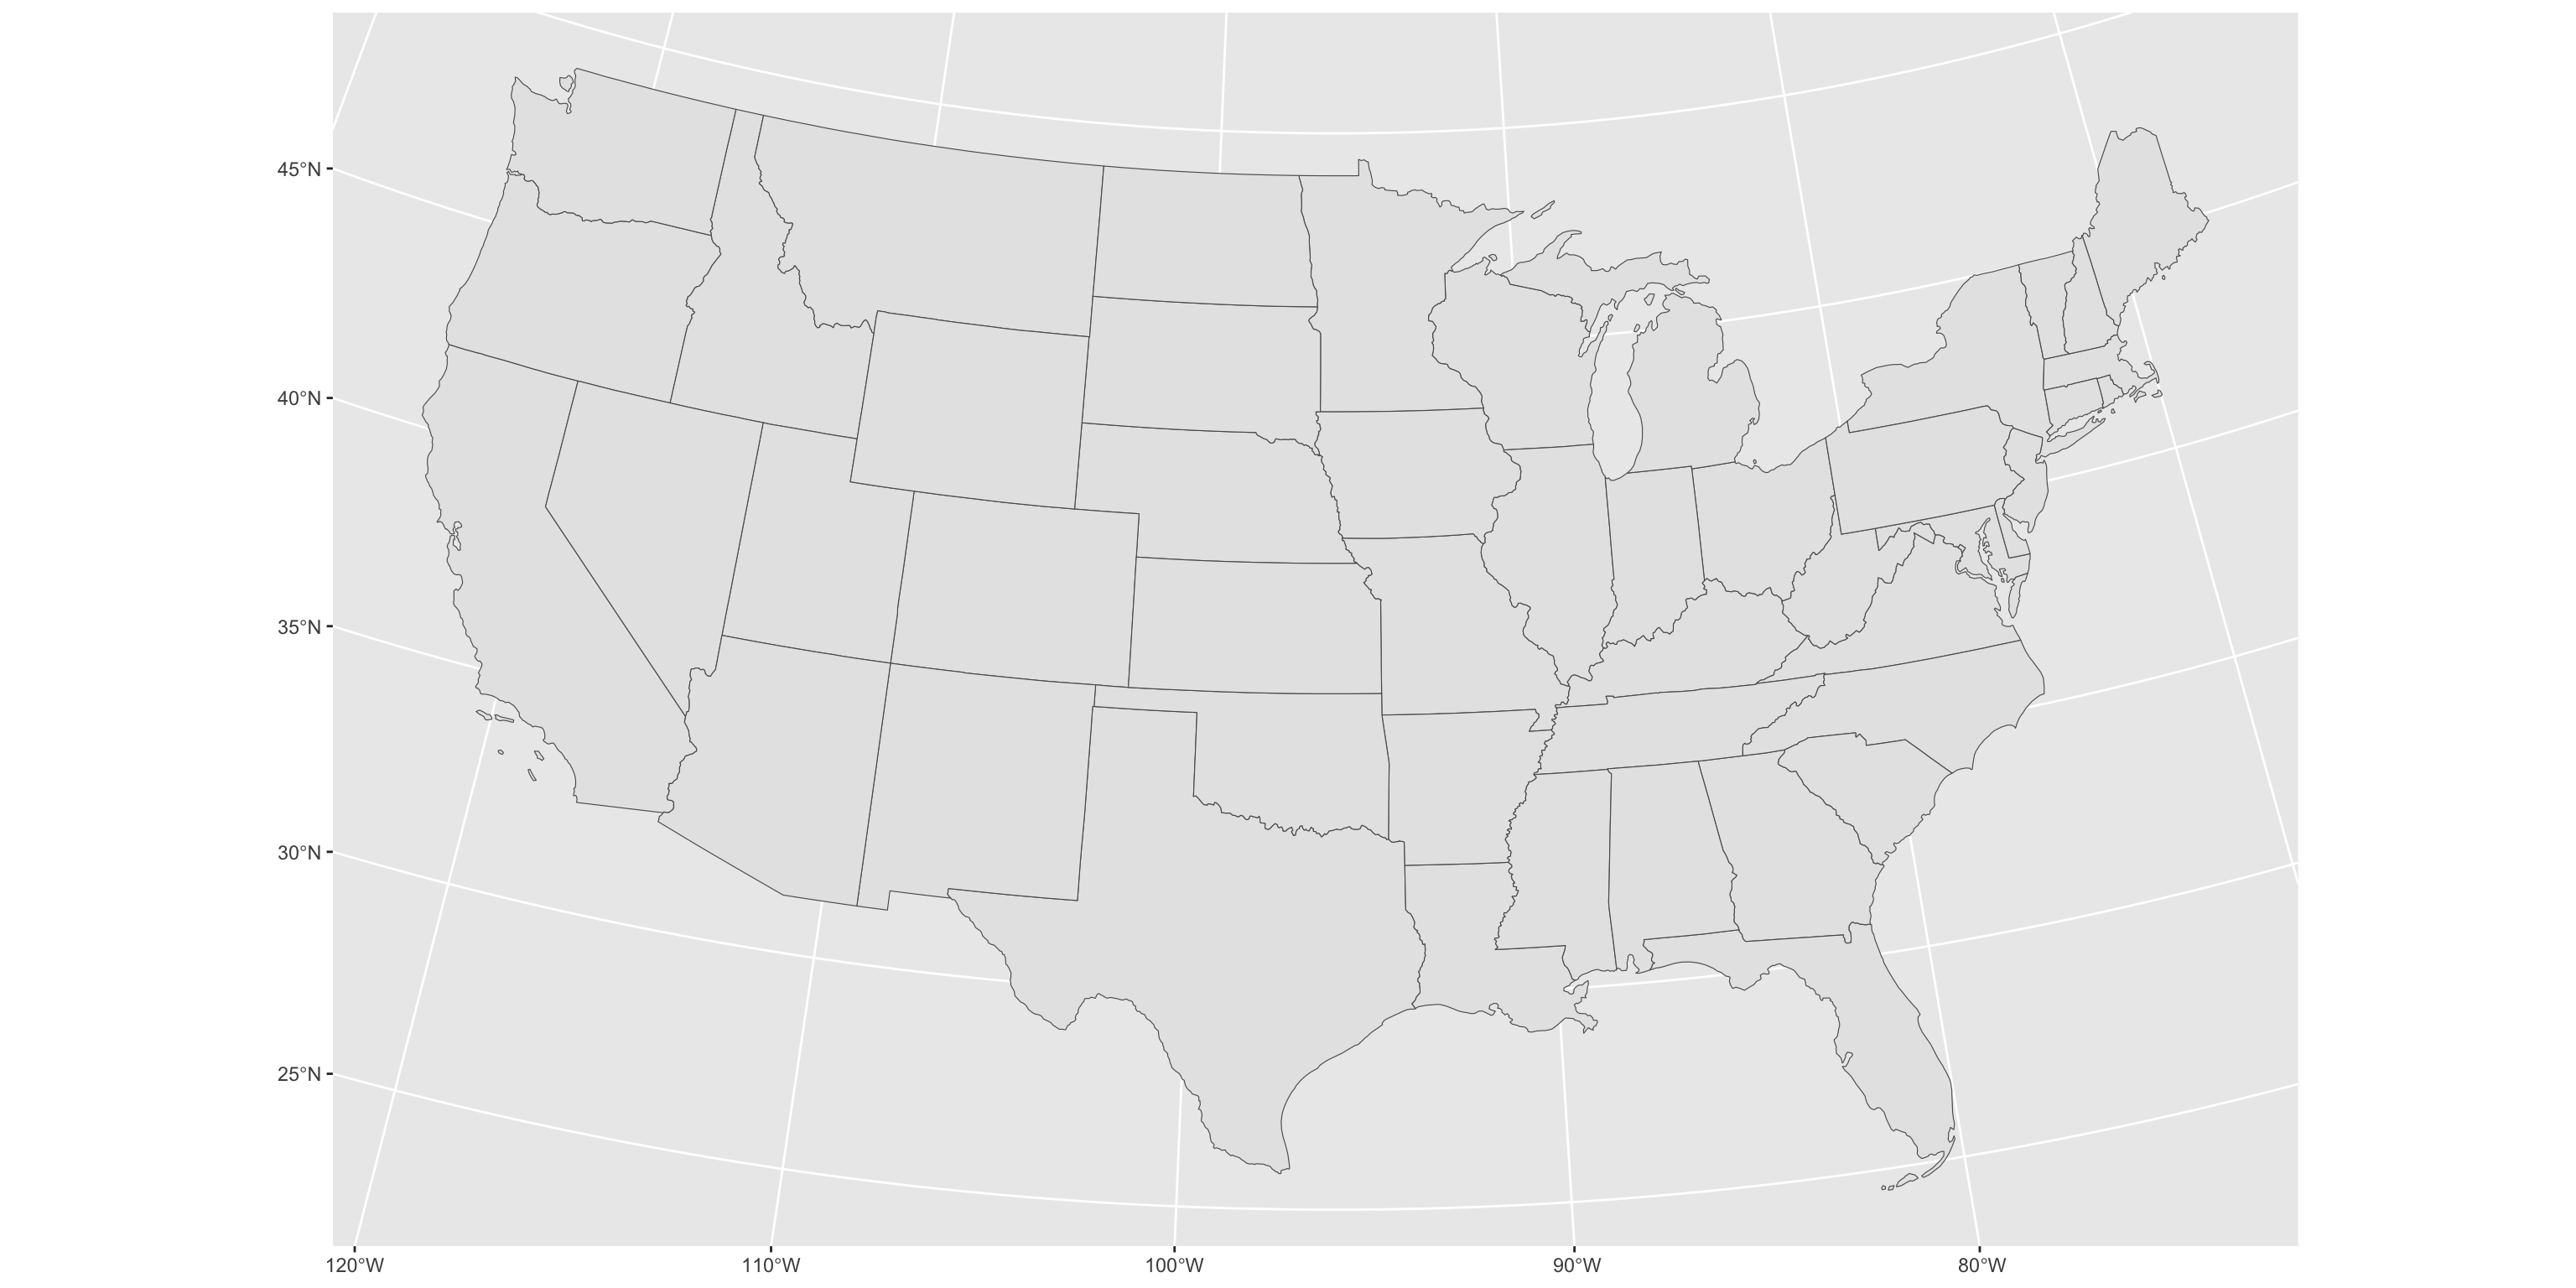
coord_sf() reprojects the visualization without modifying your data. This single line is the most impactful improvement you can make to a US national map.
Applying a Projection
Styling
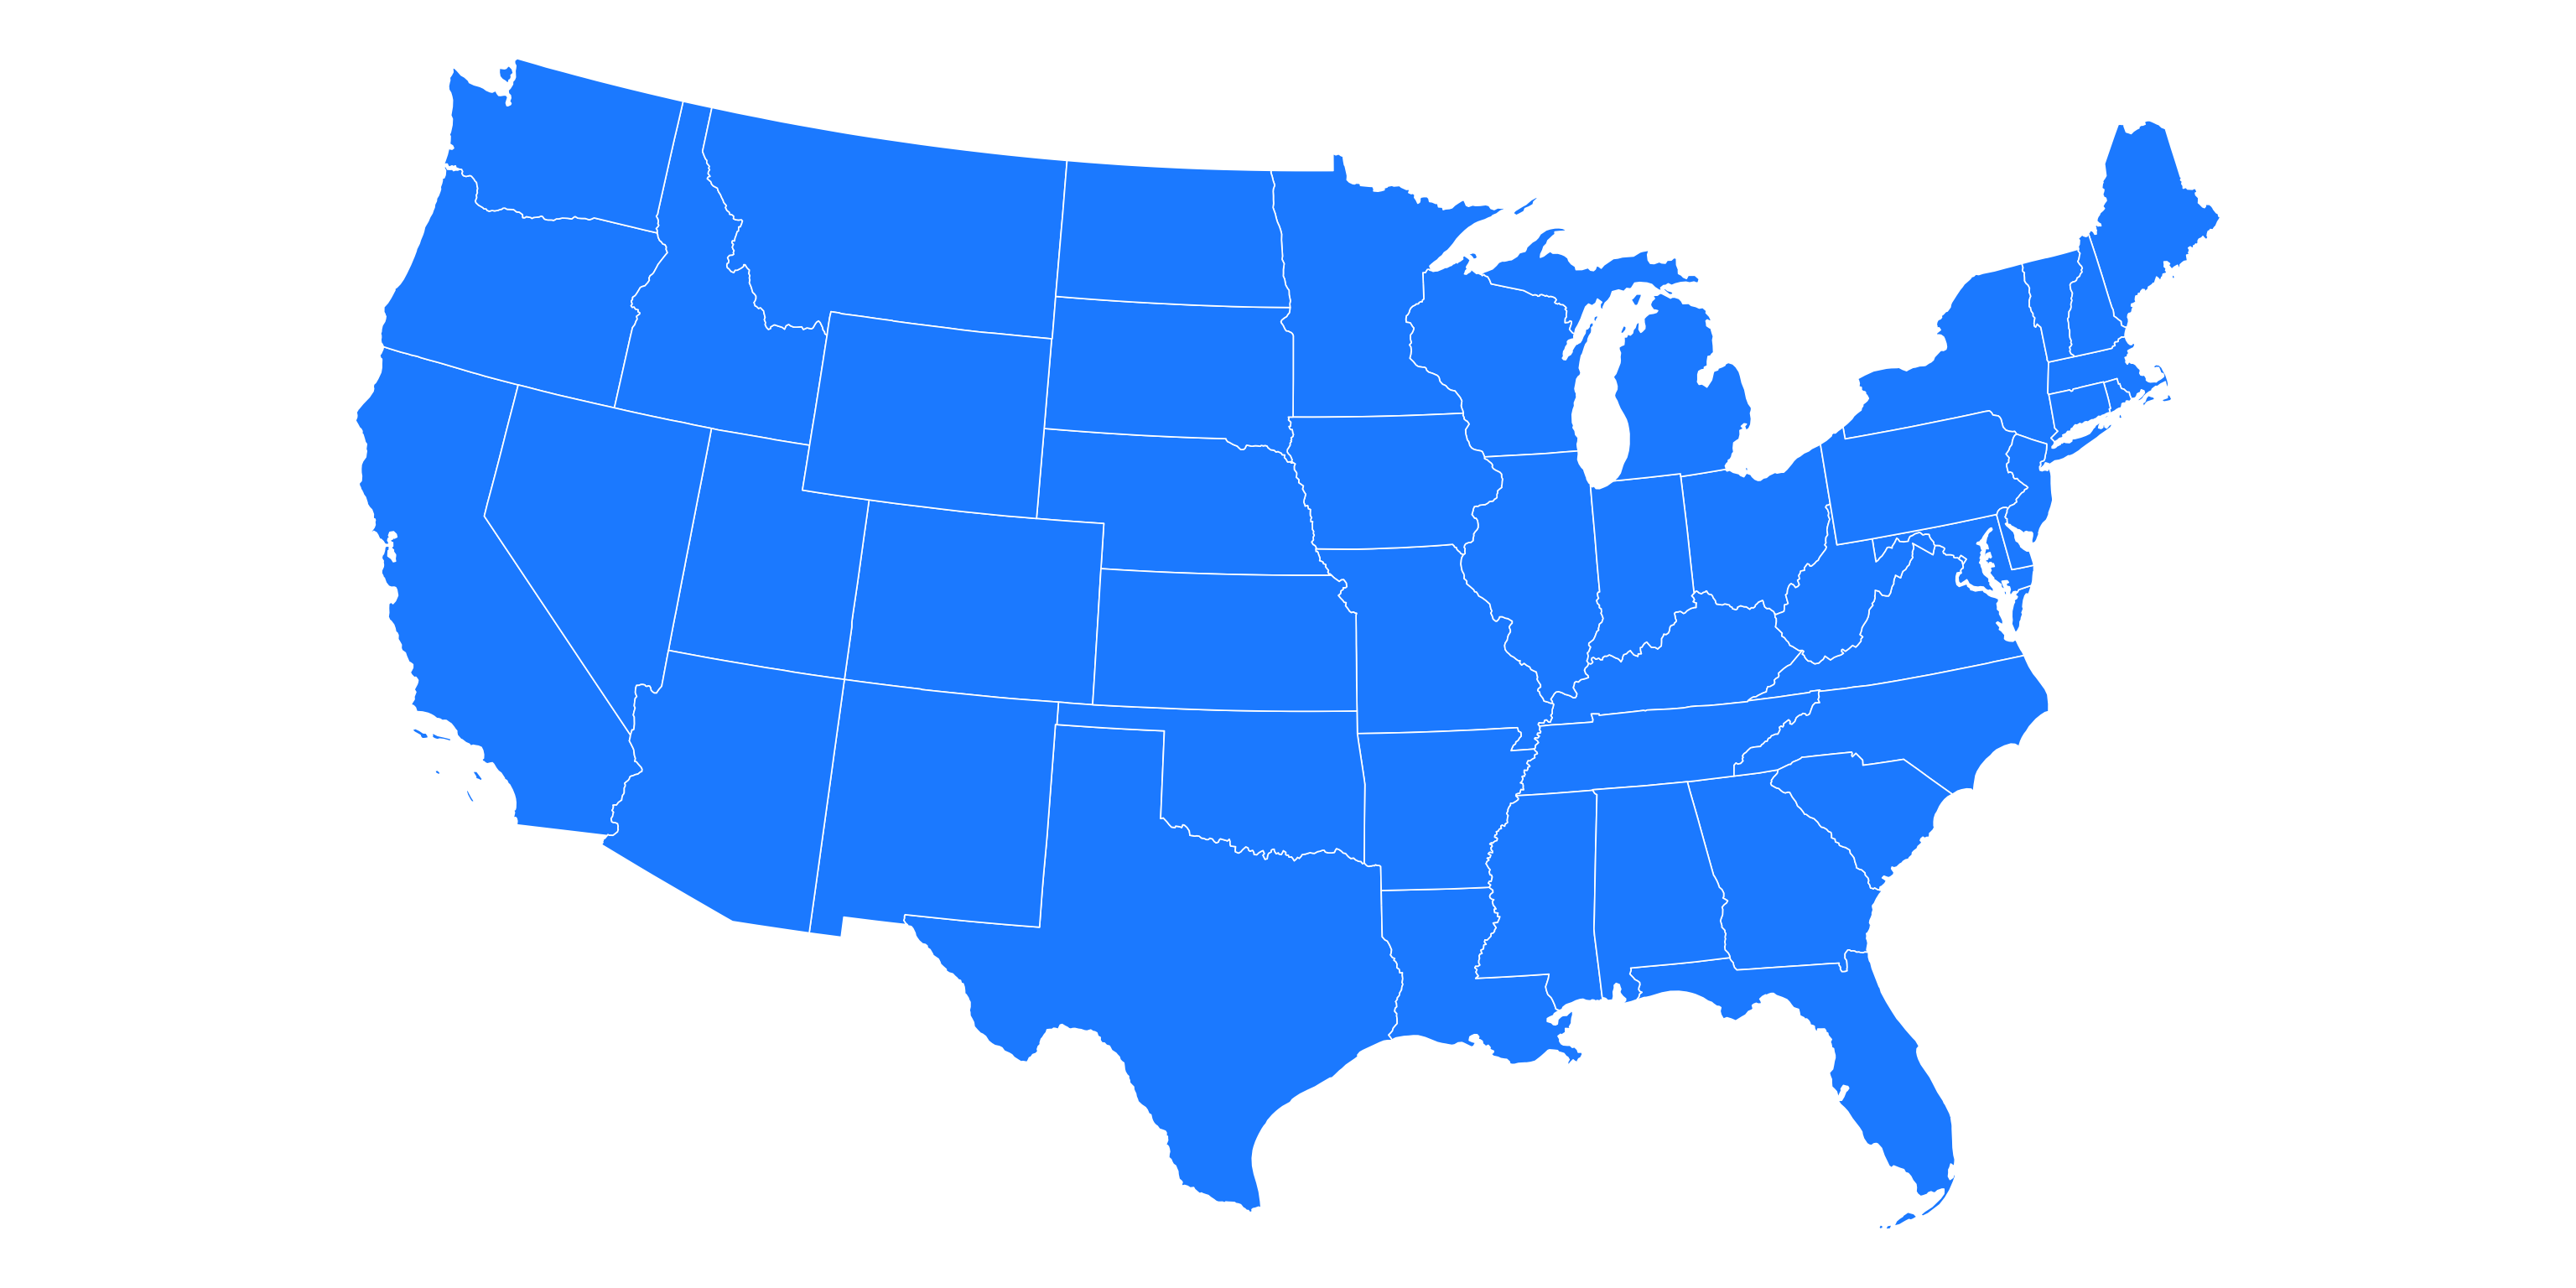
theme_void() removes axes, gridlines, and background – almost always the right choice for a finished map.
Styling
Real Data: LACE
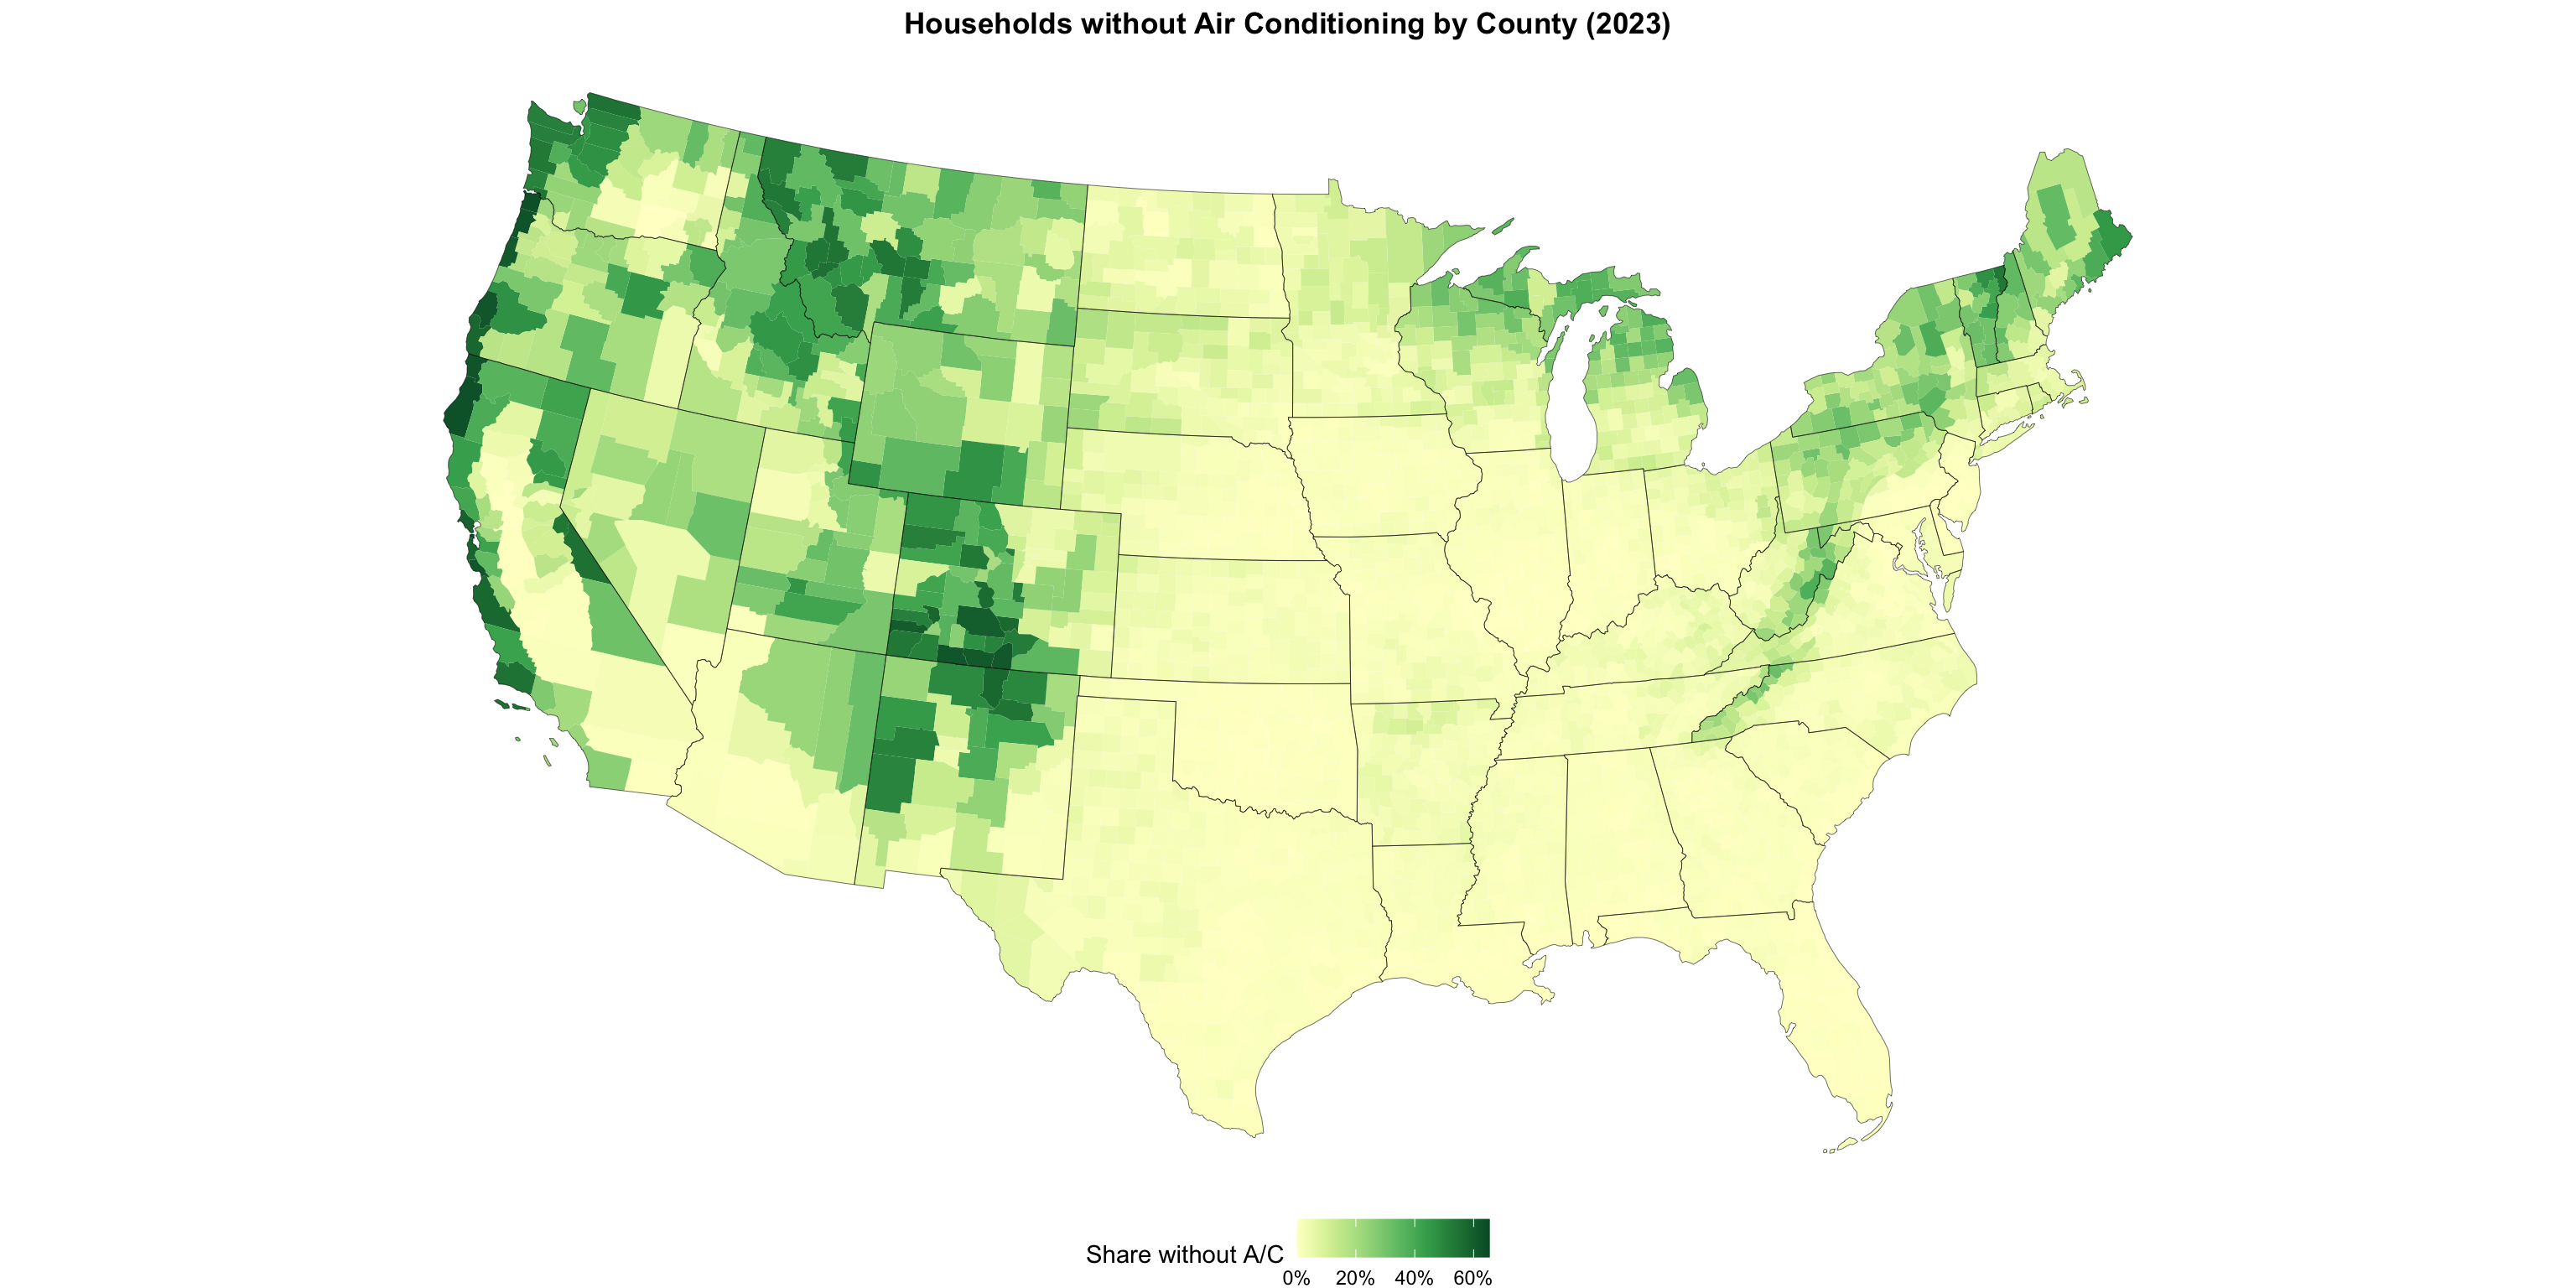
New from the Census Bureau: county-level estimates of households without air conditioning.
This is the standard workflow: get boundaries from tigris, join your data on GEOID, map it.
Building the Map Incrementally
ggplot(lace_map) +
geom_sf(aes(fill = NO_AC_PE/100), color = NA) +
geom_sf(data = states_sf, fill = NA, color = "black", linewidth = 0.1) +
coord_sf(crs = 5070) +
scale_fill_distiller(
palette = "YlGn", direction = 1,
labels = percent, name = "Share without A/C"
) +
theme_void() +
theme(legend.position = "bottom",
plot.title = element_text(face = "bold", hjust = .5)) +
labs(title = "Households without Air Conditioning by County (2023)")Building the Map Incrementally
Color Scale Options
# Sequential (one hue, light to dark)
scale_fill_distiller(palette = "YlGn", direction = 1)
scale_fill_viridis_c(option = "rocket")
# Diverging (two hues, use when 0 means something)
scale_fill_distiller(palette = "RdBu", direction = 1)
# Right-skewed data: log-transform the scale
scale_fill_viridis_c(trans = "log10", labels = scales::comma)Avoid rainbow palettes (
rainbow(),jet). They are not perceptually uniform and create false visual boundaries in your data.
- ColorBrewer (colorbrewer2.org) — designed by cartographer Cynthia Brewer, it provides rigorously tested sequential, diverging, and qualitative palettes optimized for maps. No need to reinvent the wheel; the cartographers already laid the groundwork.
Part 3: Census and NASS Data
tidycensus
tidycensus pulls Census Bureau data directly into R, with geometry attached if you want it.
Covers: Decennial Census, ACS 1-year and 5-year, and more
Finding Variables
# A tibble: 162 × 3
name label concept
<chr> <chr> <chr>
1 B09010_002 Estimate!!Total:!!Living in household with Supplemental S… Receip…
2 B09010_003 Estimate!!Total:!!Living in household with Supplemental S… Receip…
3 B09010_004 Estimate!!Total:!!Living in household with Supplemental S… Receip…
4 B09010_005 Estimate!!Total:!!Living in household with Supplemental S… Receip…
5 B09010_006 Estimate!!Total:!!Living in household with Supplemental S… Receip…
6 B09010_007 Estimate!!Total:!!Living in household with Supplemental S… Receip…
7 B09010_008 Estimate!!Total:!!Living in household with no Supplementa… Receip…
8 B09010_009 Estimate!!Total:!!Living in household with no Supplementa… Receip…
9 B09010_010 Estimate!!Total:!!Living in household with no Supplementa… Receip…
10 B09010_011 Estimate!!Total:!!Living in household with no Supplementa… Receip…
# ℹ 152 more rowsThere are ~27,000 ACS 5-year variables. load_variables() + str_detect() is how you find what you need.
Pulling SNAP Data with Geometry
snap_households <- get_acs(
geography = "county",
variables = c(snap = "B22003_002",
total = "B22003_001"),
year = 2022,
geometry = TRUE
) %>%
select(GEOID, NAME, variable, estimate) %>%
pivot_wider(names_from = variable, values_from = estimate) %>%
mutate(snap_pct = snap / total) %>%
filter(!str_starts(GEOID, "02|15|72"))geometry = TRUE is the killer feature: one call returns data and boundaries together.
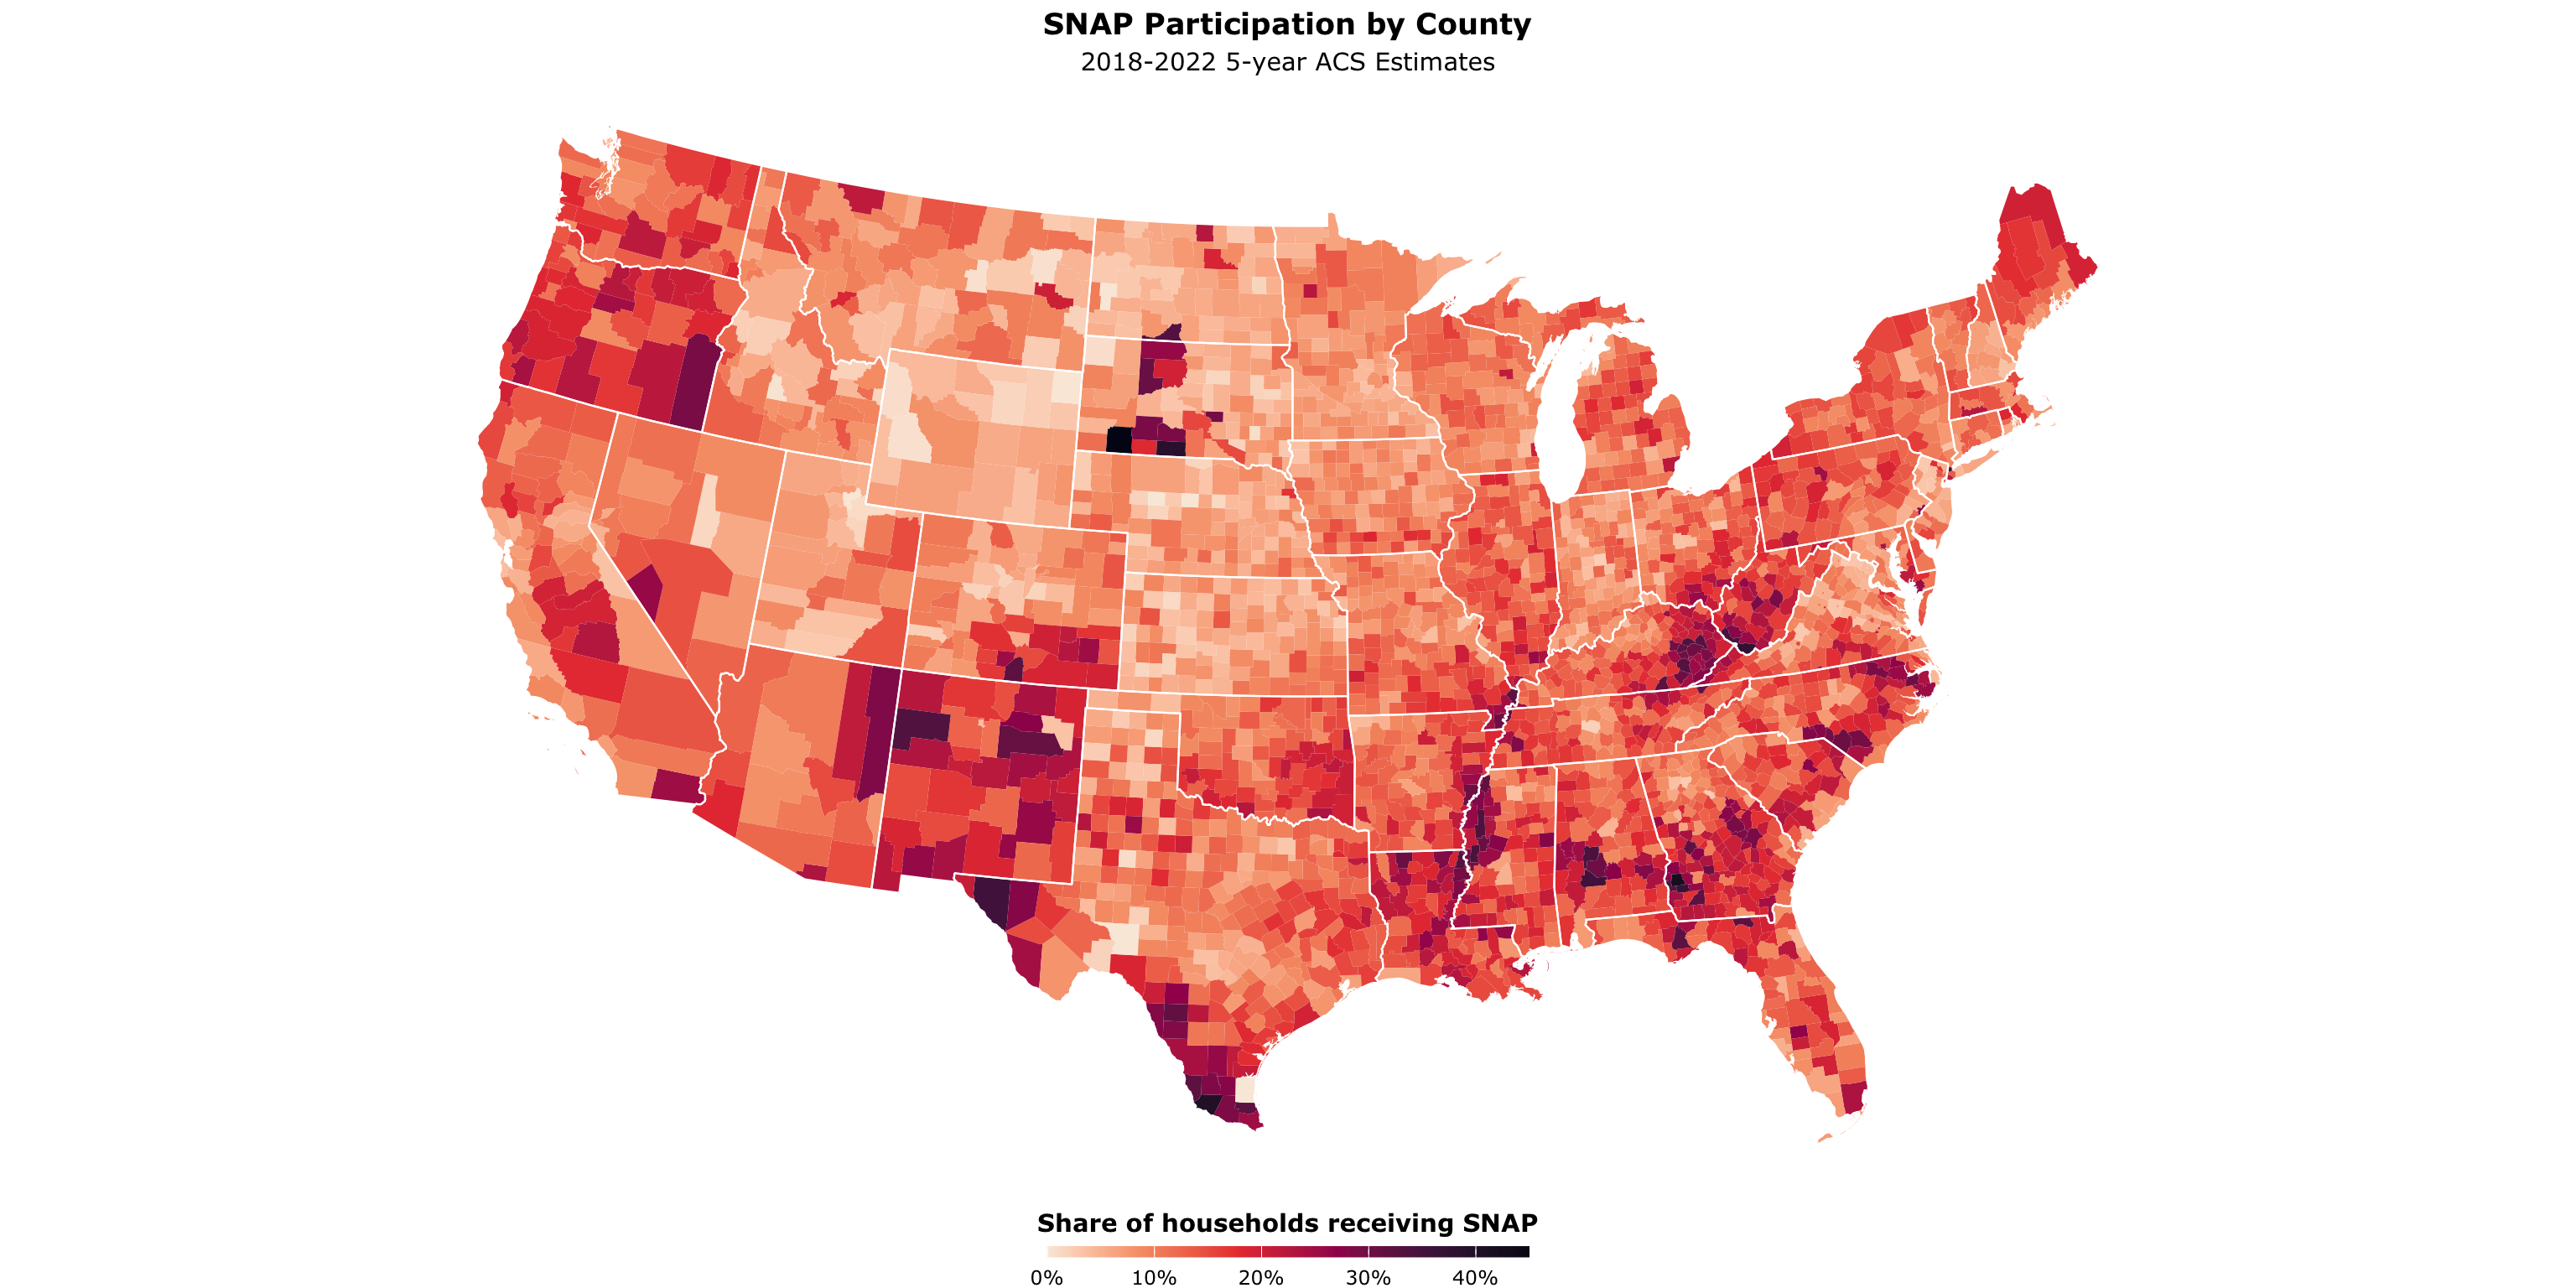
SNAP Participation by County
ggplot(snap_households) +
geom_sf(aes(fill = snap_pct), color = NA) +
geom_sf(data = states_sf, fill = NA, color = "white", linewidth = 0.4) +
coord_sf(crs = 5070) +
scale_fill_viridis_c(
name = "Share of households receiving SNAP",
labels = percent_format(accuracy = 1),
option = "rocket",
direction = -1
) +
theme_void(base_family = "Verdana") +
theme(legend.position = "bottom",
legend.title = element_text(face = "bold", hjust = .5),
plot.title = element_text(face = "bold", hjust = .5),
plot.subtitle = element_text(hjust = .5)) +
guides(fill = guide_colourbar(barheight = 0.35, barwidth = 15, title.position = "top")) +
labs(title = "SNAP Participation by County",
subtitle = "2018-2022 5-year ACS Estimates")SNAP Participation by County
Going Smaller: Census Tracts
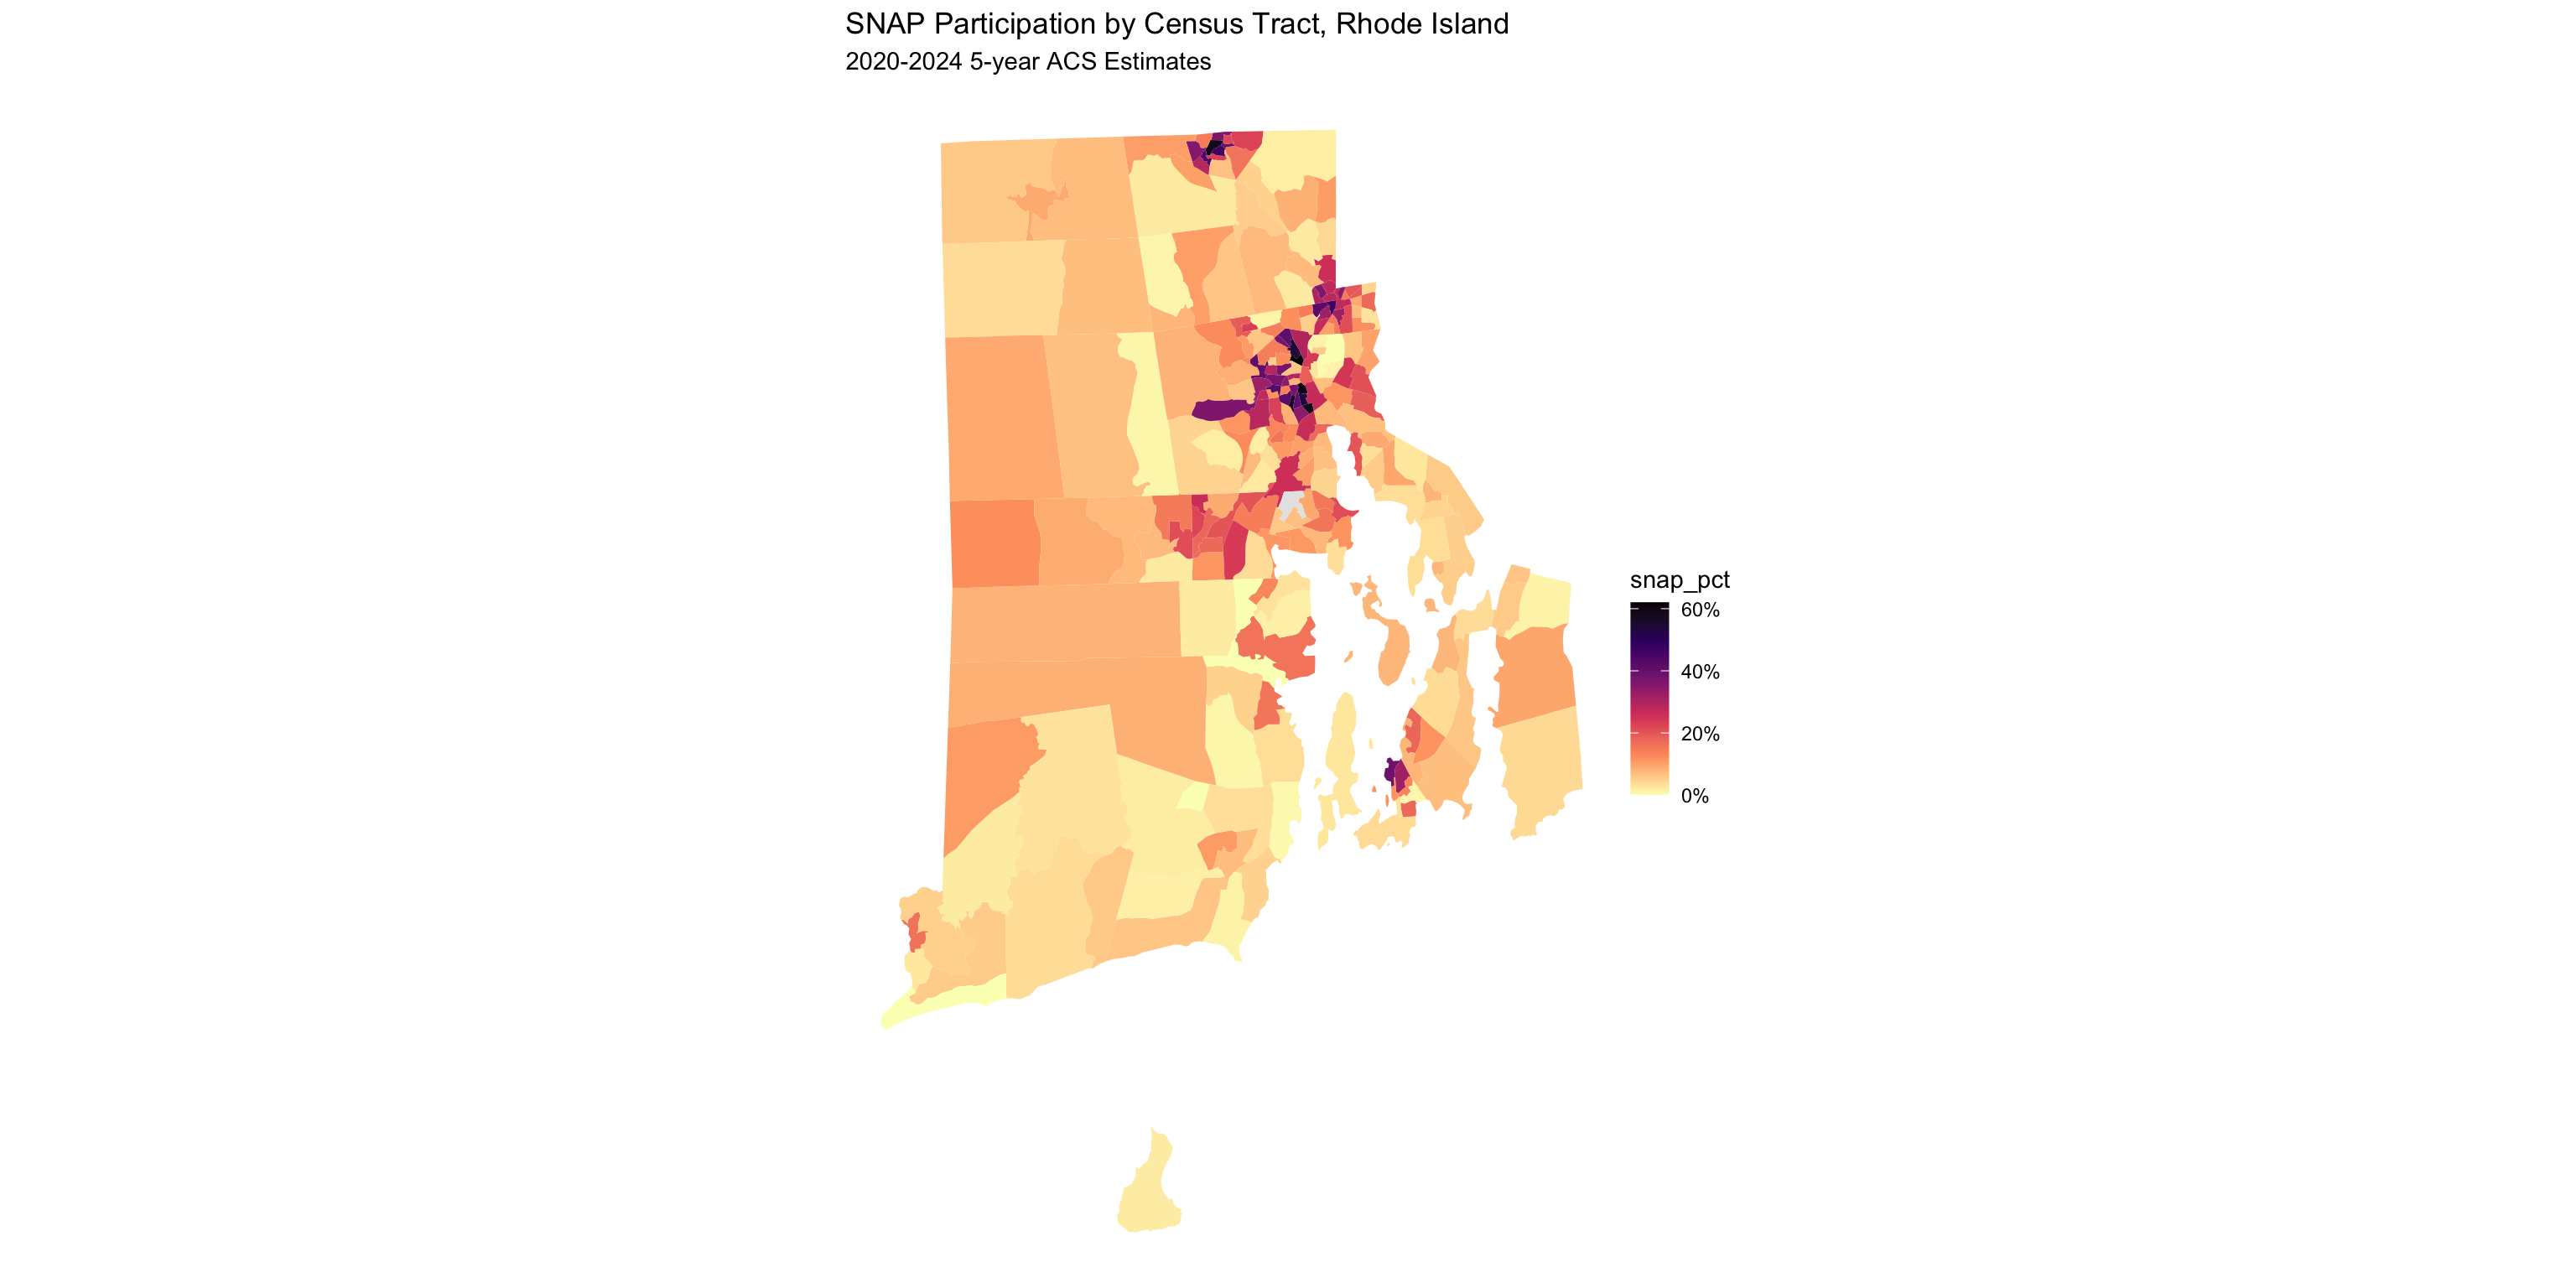
Change geography = "county" to geography = "tract" and add a state argument:
get_acs(
geography = "tract", state = "RI",
variables = c(snap = "B22003_002", total = "B22003_001"),
year = 2024, geometry = TRUE
) %>%
select(GEOID, NAME, variable, estimate) %>%
pivot_wider(names_from = variable, values_from = estimate) %>%
mutate(snap_pct = snap / total) %>%
ggplot() +
geom_sf(aes(fill = snap_pct), color = NA) +
scale_fill_viridis_c(option = "A", direction = -1,
labels = percent_format(accuracy = 1),
na.value = "grey90") +
theme_void() +
labs(title = "SNAP Participation by Census Tract, Rhode Island",
subtitle = "2020-2024 5-year ACS Estimates")Going Smaller: Census Tracts
NASS QuickStats: rnassqs
NASS QuickStats is USDA’s public database: crops, livestock, farm economics, farm counts, and more.
Tip: prototype at quickstats.nass.usda.gov first to get exact parameter names and verify record counts before calling the API.
Querying NASS: Corn and Soybeans
corn_acres <- nassqs(
commodity_desc = "CORN", short_desc = "CORN - ACRES PLANTED",
domain_desc = "TOTAL", agg_level_desc = "COUNTY", year = 2015
) %>%
mutate(GEOID = paste0(state_fips_code, county_code)) %>%
select(GEOID, year, corn_acres_planted = Value)
soybean_acres <- nassqs(
commodity_desc = "SOYBEANS", short_desc = "SOYBEANS - ACRES PLANTED",
domain_desc = "TOTAL", agg_level_desc = "COUNTY", year = 2015
) %>%
mutate(GEOID = paste0(state_fips_code, county_code)) %>%
select(GEOID, year, soybean_acres_planted = Value)
corn_acres_sf <- left_join(counties_sf, corn_acres)
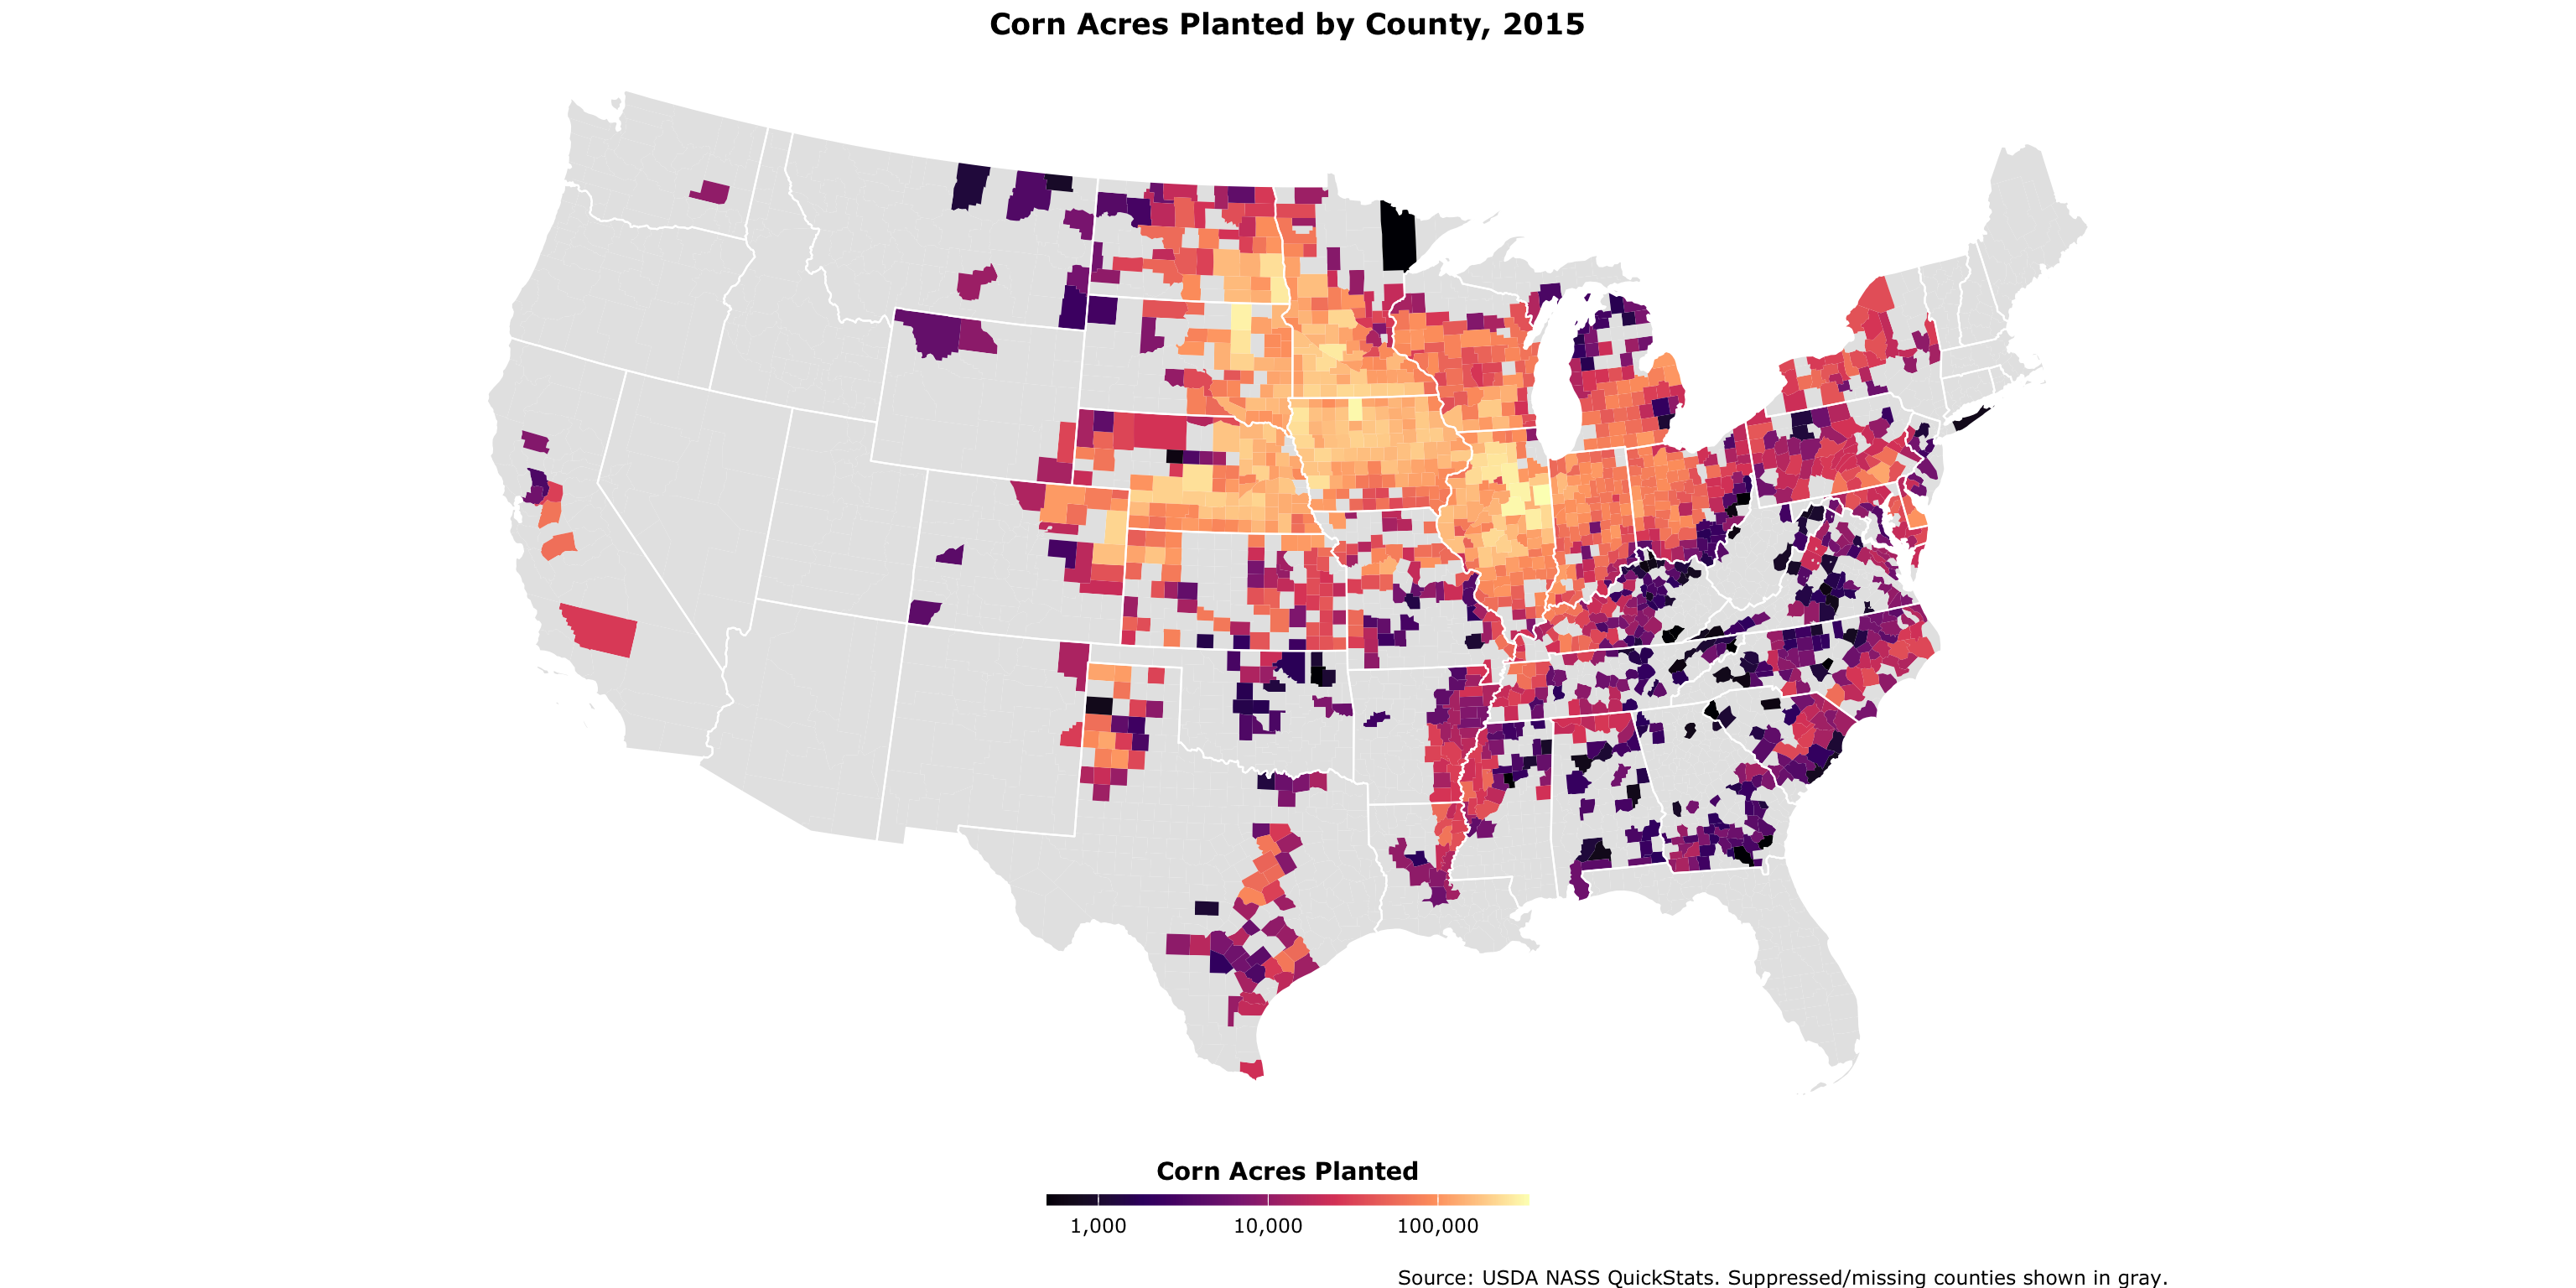
soybean_acres_sf <- left_join(counties_sf, soybean_acres)Corn Acres Planted, 2015
ggplot(corn_acres_sf) +
geom_sf(aes(fill = corn_acres_planted), color = NA) +
geom_sf(data = states_sf, fill = NA, color = "white", linewidth = 0.4) +
coord_sf(crs = 5070) +
scale_fill_viridis_c(option = "A", name = "Corn Acres Planted",
labels = comma_format(), trans = "log10", na.value = "gray90") +
theme_void(base_family = "Verdana") +
theme(legend.position = "bottom",
legend.title = element_text(face = "bold", hjust = .5),
plot.title = element_text(face = "bold", hjust = .5)) +
guides(fill = guide_colourbar(barheight = 0.35, barwidth = 15, title.position = "top")) +
labs(title = "Corn Acres Planted by County, 2015",
caption = "\nSource: USDA NASS QuickStats. Suppressed/missing counties shown in gray.")Corn Acres Planted, 2015
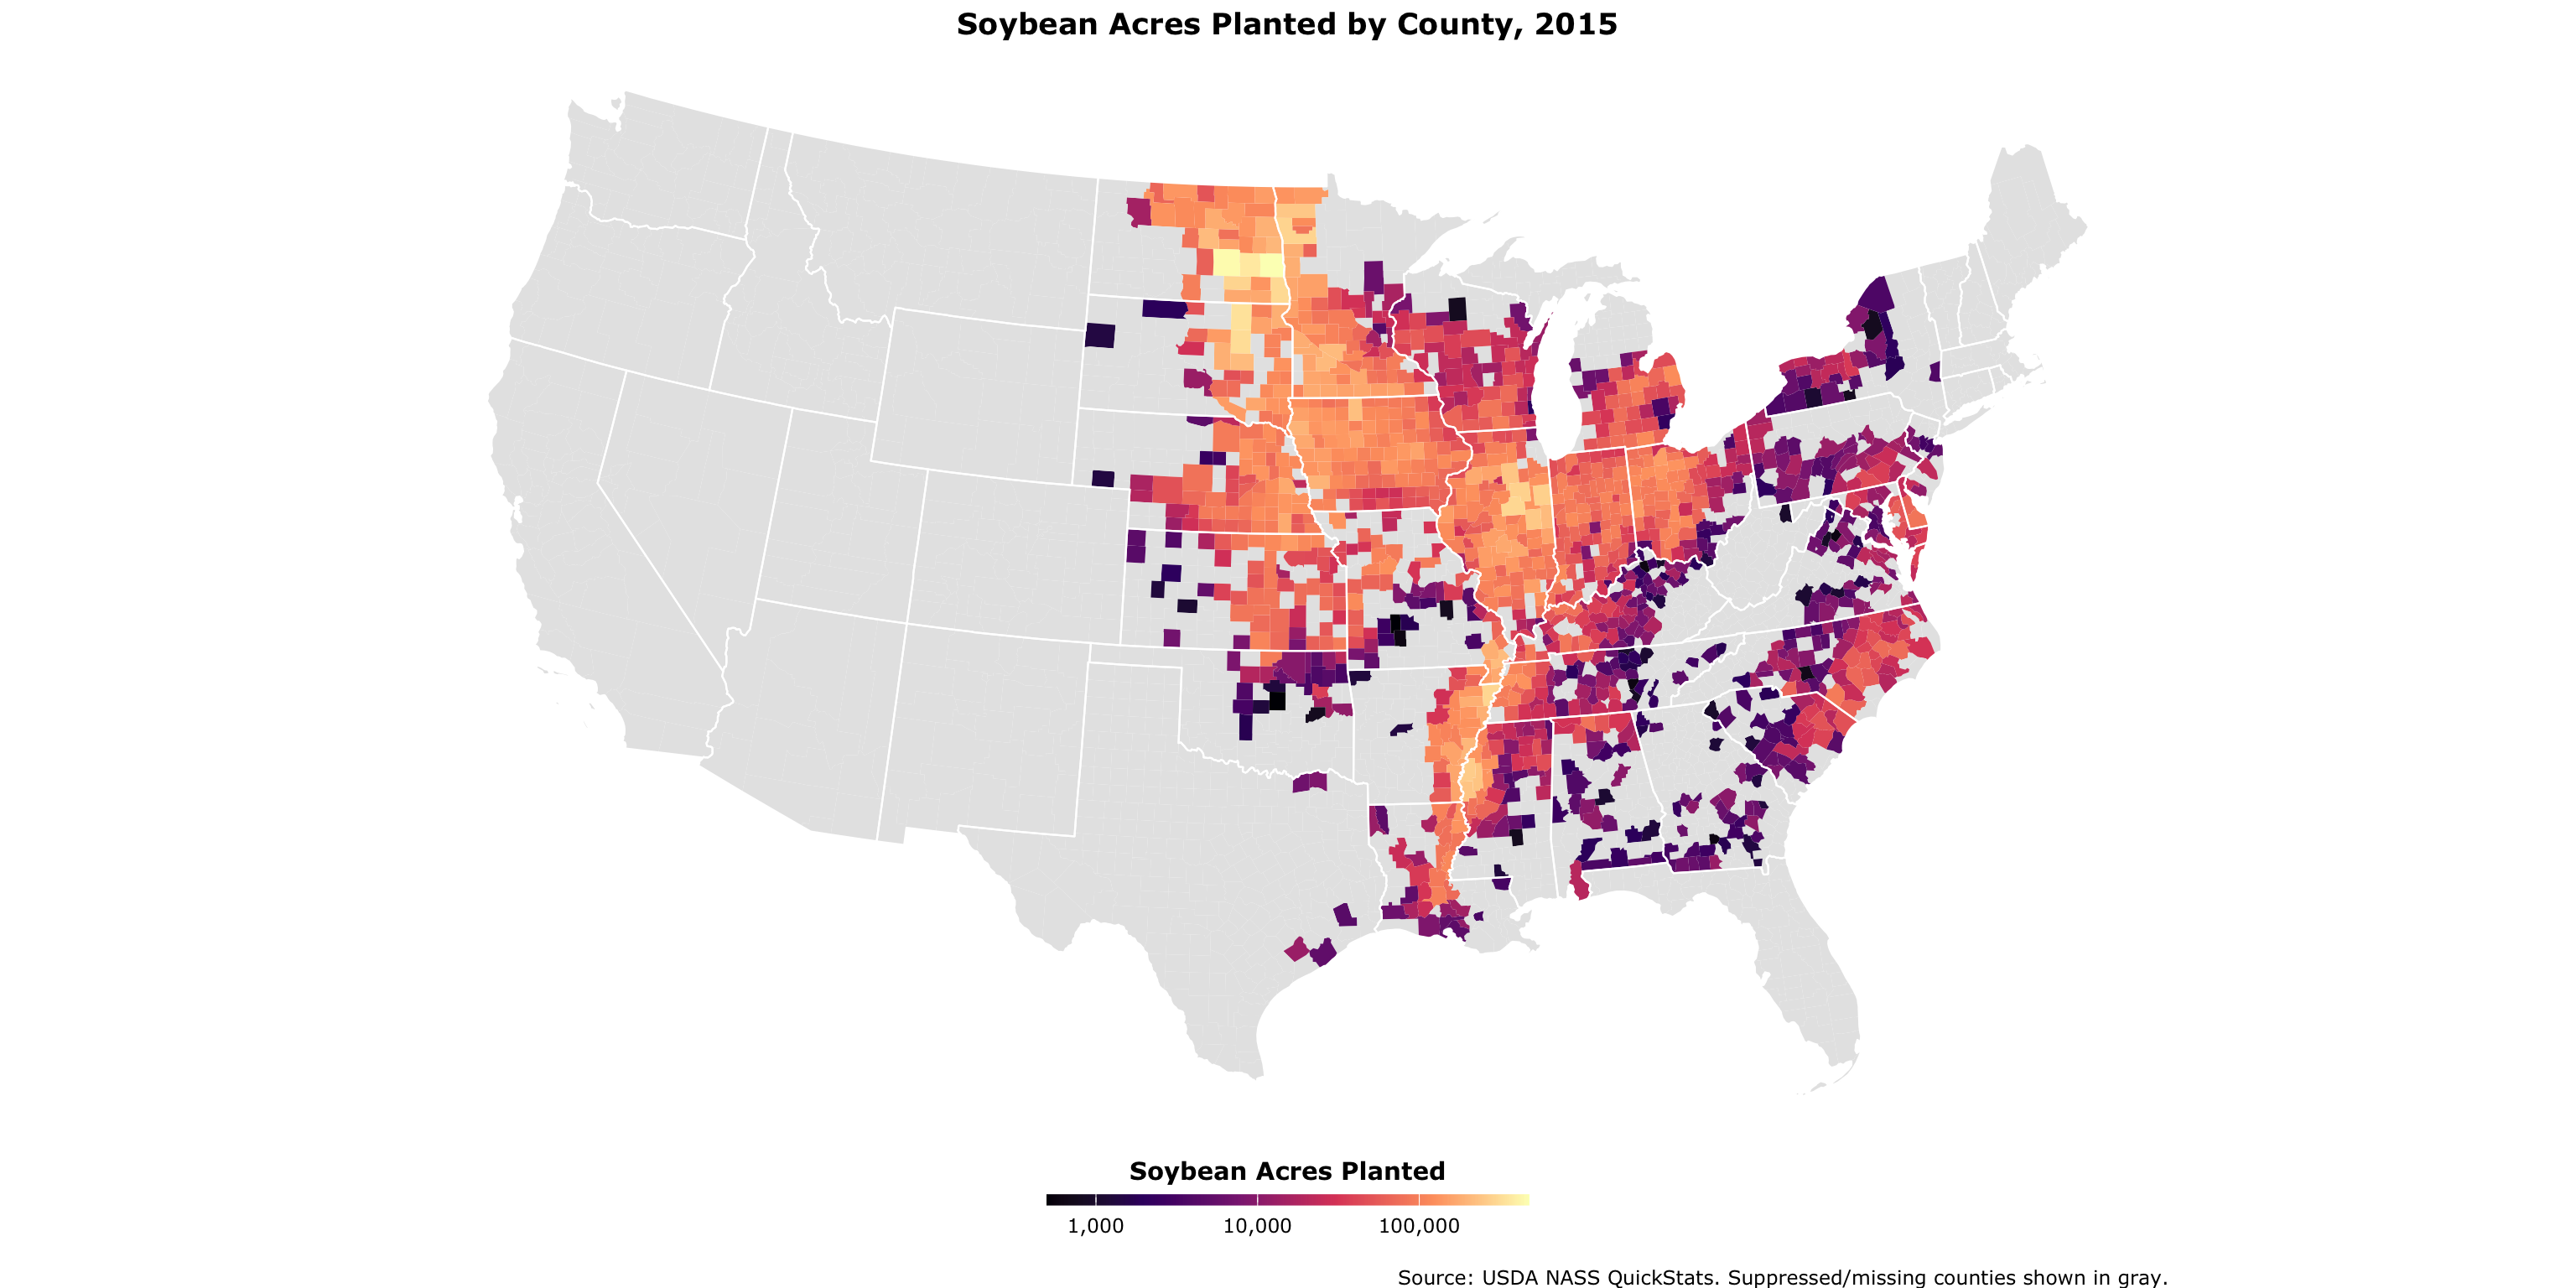
Soybean Acres Planted, 2015
ggplot(soybean_acres_sf) +
geom_sf(aes(fill = soybean_acres_planted), color = NA) +
geom_sf(data = states_sf, fill = NA, color = "white", linewidth = 0.4) +
coord_sf(crs = 5070) +
scale_fill_viridis_c(option = "A", name = "Soybean Acres Planted",
labels = comma_format(), trans = "log10", na.value = "gray90") +
theme_void(base_family = "Verdana") +
theme(legend.position = "bottom",
legend.title = element_text(face = "bold", hjust = .5),
plot.title = element_text(face = "bold", hjust = .5)) +
guides(fill = guide_colourbar(barheight = 0.35, barwidth = 15, title.position = "top")) +
labs(title = "Soybean Acres Planted by County, 2015",
caption = "\nSource: USDA NASS QuickStats. Suppressed/missing counties shown in gray.")Soybean Acres Planted, 2015
Finding Better Breaks: Jenks
Right-skewed ag data looks like one color with a linear scale. Jenks natural breaks fix that.
corn_vals <- as.numeric(str_remove_all(corn_acres_sf$corn_acres_planted, ","))
soy_vals <- as.numeric(str_remove_all(soybean_acres_sf$soybean_acres_planted, ","))
combined <- c(corn_vals, soy_vals)
brks <- classIntervals(
combined[!is.na(combined) & combined > 0], n = 5, style = "jenks"
)$brks %>% round(-3)
pal <- brewer.pal(length(brks), "YlGn")Using the combined distribution ensures both maps share the same color scale.
Comparing Maps with compare()
left_map <- maplibre(bounds = states_sf, style = carto_style("voyager")) %>%
add_fill_layer(id = "corn_acres", source = corn_acres_sf,
fill_color = interpolate(column = "corn_acres_planted",
values = brks, stops = pal, na_color = "lightgrey"),
fill_opacity = 0.9, tooltip = "corn_acres_planted") %>%
add_line_layer(id = "states", source = states_sf, line_width = .1) %>%
add_continuous_legend("Corn Acres Planted, 2015",
values = brks, colors = pal, position = "top-left")
right_map <- maplibre(bounds = states_sf, style = carto_style("voyager")) %>%
add_fill_layer(id = "soybean_acres", source = soybean_acres_sf,
fill_color = interpolate(column = "soybean_acres_planted",
values = brks, stops = pal, na_color = "lightgrey"),
fill_opacity = 0.9, tooltip = "soybean_acres_planted") %>%
add_line_layer(id = "states", source = states_sf, line_width = .1) %>%
add_continuous_legend("Soybean Acres Planted, 2015",
values = brks, colors = pal, position = "top-left")
compare(left_map, right_map, height = "900px")Comparing Maps with compare()
Part 4: Point Data and GIS
From Table to Map
Any table with latitude and longitude columns can become a spatial dataset.
Rows: 7,185
Columns: 21
$ establishment_id <dbl> 126740, 195, 126734, 126639, 6164012, 8204, 8193,…
$ establishment_number <chr> "G1016", "G1028", "G1105", "G1126A+V1126A", "G112…
$ establishment_name <chr> "M.G. Waldbaum Company", "Papetti's Hygrade Egg P…
$ duns_number <chr> "18076351", "7266158", NA, "72983554", "15396242"…
$ street <chr> "430 Railroad Avenue", "One Papetti Plaza", "375 …
$ city <chr> "Gaylord", "Elizabeth", "Blackshear", "Spanish Fo…
$ state <chr> "MN", "NJ", "GA", "UT", "UT", "IL", "NJ", "IA", "…
$ zip <chr> "55334", "7206", "31516", "84660", "84660", "6283…
$ phone <chr> "(507) 237-4600", "(908) 282-7900", "(912) 449-57…
$ grant_date <chr> "1/28/2026", "12/5/2019", "9/22/2021", "1/28/2022…
$ activities <chr> "Egg Product", "Egg Product", "Egg Product", "Cer…
$ dbas <chr> "Michael Foods Inc.", NA, NA, NA, "Muscle Egg", N…
$ district <dbl> 25, 80, 85, 15, 15, 50, 80, 25, 25, 50, 60, 15, 8…
$ circuit <chr> "2507", "8020", "8509", "1532", "1532", "5007", "…
$ size <chr> "N / A", "Small", "Small", "Small", "Very Small",…
$ latitude <dbl> 44.55444, 40.65799, 31.30408, 40.11510, 40.11414,…
$ longitude <dbl> -94.20699, -74.18885, -82.23269, -111.73739, -111…
$ county <chr> "Sibley County", "Union County", "Pierce County",…
$ fips_code <dbl> 27143, 34039, 13229, 49049, 49049, 17051, 34039, …
$ LatestMPIActiveDate <chr> "6/1/2026", "6/1/2026", "6/1/2026", "6/1/2026", "…
$ est_status <lgl> NA, NA, NA, NA, NA, NA, NA, NA, NA, NA, NA, NA, N…st_as_sf(): Adding Geometry
usda_inspection_estabs_sf <- usda_inspection_estabs %>%
mutate(across(where(is.character), ~iconv(., to = "UTF-8", sub = ""))) %>%
st_as_sf(coords = c("longitude", "latitude"), crs = 4326, remove = FALSE) %>%
st_transform(crs = 5070)
lower48_usda <- st_intersection(
usda_inspection_estabs_sf,
st_transform(states_sf, 5070)
) %>%
filter(size %in% c("Large", "Small", "Very Small"))st_as_sf() turns lat/lon columns into a geometry column. After that, it’s a normal sf object.
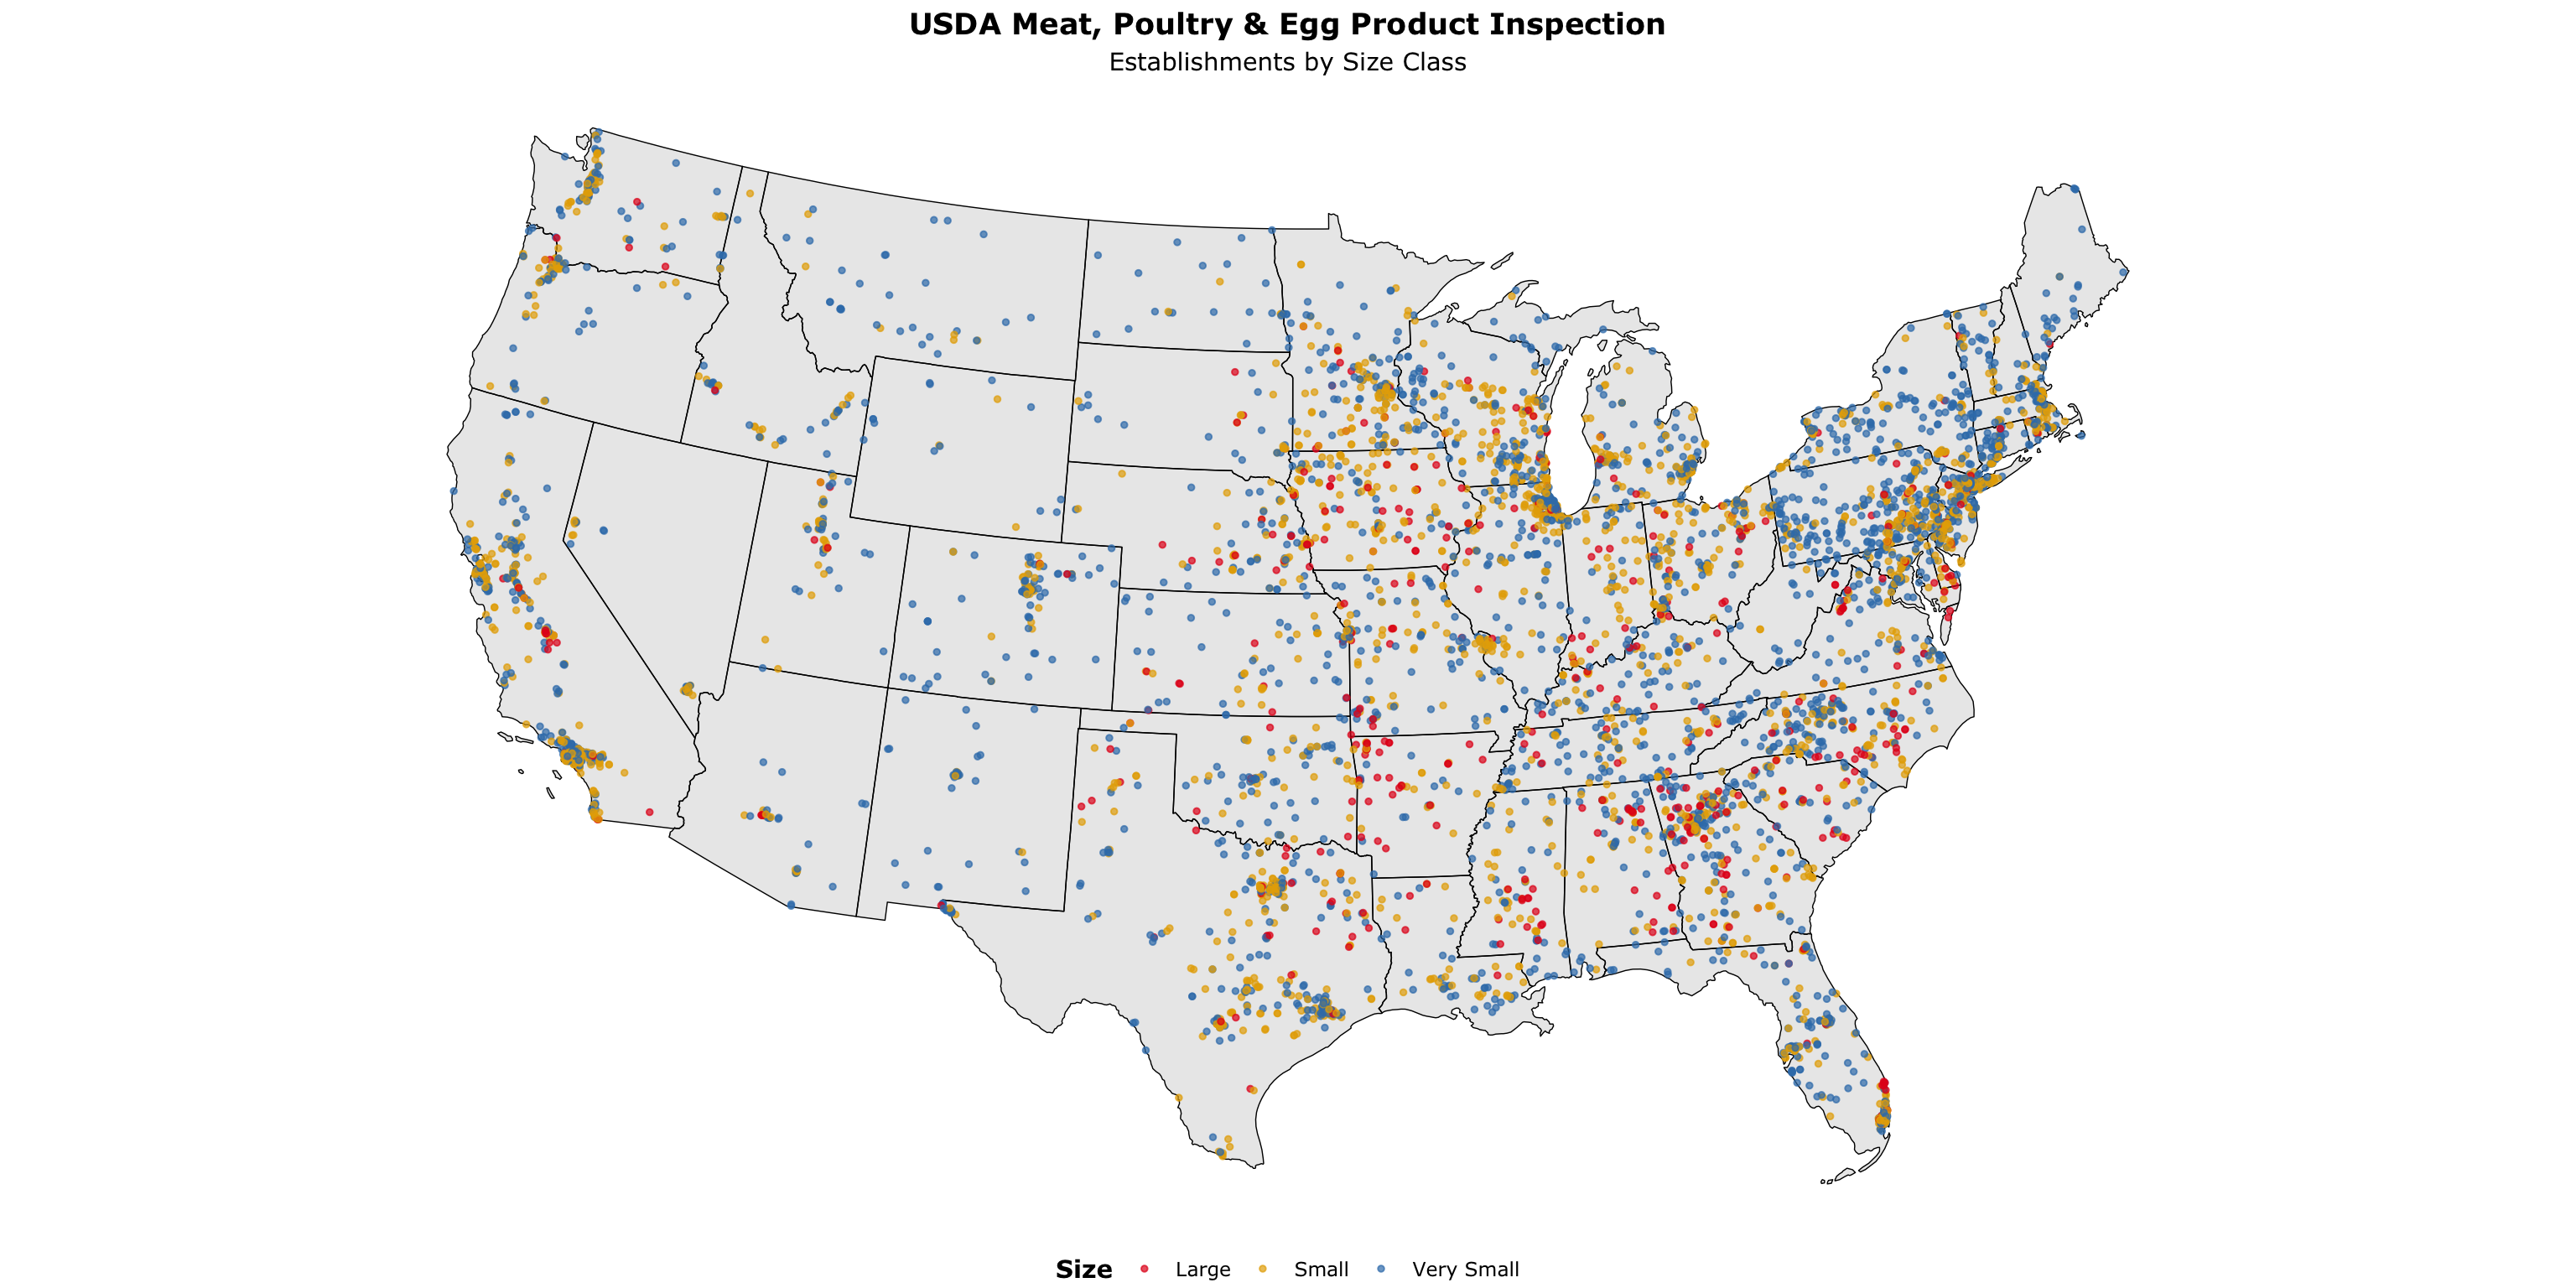
USDA Inspection Establishments
ggplot() +
geom_sf(data = st_transform(states_sf, 5070), color = "black", linewidth = .25) +
geom_sf(data = lower48_usda, aes(color = size), size = 1, alpha = .7) +
scale_color_manual(values = c("#e41a1c", "#e6ab02", "#377eb8"), name = "Size") +
theme_void(base_family = "Verdana") +
theme(legend.position = "bottom",
legend.title = element_text(face = "bold", hjust = .5),
plot.subtitle = element_text(hjust = .5),
plot.title = element_text(face = "bold", hjust = .5)) +
labs(title = "USDA Meat, Poultry & Egg Product Inspection",
subtitle = "Establishments by Size Class")USDA Inspection Establishments
Categorical Point Maps with mapgl
gas_stations <- read_csv("https://andrewvanleuven.github.io/aaea_webinar/data/gas_stations.csv") %>%
st_as_sf(wkt = "geometry_wkt", crs = 4326) %>%
st_transform(crs = 5070)
maplibre(style = carto_style("positron"), bounds = states_sf) %>%
add_circle_layer(
id = "poi-gas", source = gas_stations,
circle_color = match_expr("name",
values = c("Casey's General Store", "Cenex", "Kwik Trip/Kwik Star"),
stops = c("#F3D317", "#8a0000", "#0300ad")),
circle_radius = 4, circle_stroke_color = "#ffffff",
circle_stroke_width = .4, circle_opacity = 0.7, tooltip = "city_name"
) %>%
add_line_layer(id = "states", source = states_sf, line_width = .1) %>%
add_categorical_legend(
legend_title = "Midwest Gas Station Chains",
values = c("Casey's General Store", "Cenex", "Kwik Trip/Kwik Star"),
colors = c("#F3D317", "#8a0000", "#0300ad"),
patch_shape = "circle", position = "bottom-left",
layer_id = "poi-gas", interactive = TRUE
)Categorical Point Maps with mapgl
Categorical Point Maps with mapgl
dollar_stores <- read_csv("https://andrewvanleuven.github.io/aaea_webinar/data/dollar_stores.csv") %>%
st_as_sf(wkt = "geometry_wkt", crs = 4326) %>%
st_transform(crs = 5070) %>%
mutate(tooltip = glue("<b>{name}</b><br>{city_name}"))
maplibre(style = carto_style("positron"), bounds = states_sf) %>%
add_circle_layer(
id = "poi-dollar-store",
source = dollar_stores,
circle_color = match_expr(
"name",
values = c("Dollar General", "Dollar Tree", "Family Dollar"),
stops = c("#fff200", "#00954C", "#E81F11")
),
circle_radius = 4,
circle_stroke_color = "black",
circle_stroke_width = .4,
circle_opacity = 0.7,
tooltip = "tooltip"
) %>%
add_categorical_legend(
legend_title = "Dollar Store Establishments",
values = c("Dollar General", "Dollar Tree", "Family Dollar"),
colors = c("#fff200", "#00954C", "#E81F11"),
patch_shape = "circle",
position = "bottom-left",
layer_id = "poi-dollar-store",
interactive = TRUE
)